


Strategic Capital Allocation in the AEC Sector: Navigating the AI Hardware Versus Cloud Computing Paradigm in 2026
Joshua Smith
The Digital Transformation and the 2026 AEC Landscape
The Architecture, Engineering, and Construction (AEC) sector in the year 2026 is undergoing a profound, accelerated, and largely irreversible digital transformation. This paradigm shift is fundamentally reshaping how the built environment is conceived, analyzed, constructed, and operated across its entire lifecycle. The industry has decisively moved beyond the experimental phases of basic 3D Building Information Modeling (BIM) and is now actively grappling with the integration of BIM 6.0, interconnected digital ecosystems, advanced artificial intelligence (AI), predictive digital twins, and automated project delivery systems.1 The financial magnitude of this shift is substantial; the AEC software market has reached an estimated $11.3 billion, reflecting a massive influx of capital into construction technology (ConTech), a sector which has seen total investments exceed 4x that number.2
However, this rapid digitization has introduced a uniquely complex infrastructural dilemma for AEC firm executives, Chief Information Officers, and BIM directors. As computational design methodologies, real-time clash detection, generative architectural algorithms, and predictive maintenance models become baseline requirements for competitive survival, firms are forced to make a critical strategic decision regarding their computational infrastructure.3 They must rigorously determine whether to continue relying on third-party cloud computing solutions—characterized by Software-as-a-Service (SaaS) platforms, remote data hosting, and perpetually variable operational expenditures (OpEx)—or to repatriate their intensive computational workloads by investing heavily in sovereign, on-premise AI hardware ecosystems.
This decision is not merely a peripheral matter of routine IT procurement. Rather, it operates as a fundamental determinant of an enterprise's future profitability, operational agility, and regulatory compliance. The rigorous analysis of this infrastructural dilemma requires an exhaustive evaluation of several overlapping and highly complex domains. These include the staggering data gravity generated by modern point clouds and reality capture workflows, the compounding and punitive financial costs of cloud data egress, the increasingly stringent data sovereignty mandates imposed by defense and international regulatory bodies, and the distinct limitations of probabilistic AI models operating within the deterministic, liability-heavy realm of structural engineering. By synthesizing empirical adoption data, hardware performance benchmarks, and evolving regulatory frameworks, this report provides a comprehensive, multi-layered analysis of the ideal computational infrastructure strategy for the modern AEC enterprise.
The Macroeconomics of Artificial Intelligence Adoption in AEC
To accurately comprehend the computational infrastructural requirements of the modern AEC sector, one must first deeply analyze the current velocity, depth, and nature of AI adoption across the industry. The integration of artificial intelligence in AEC is currently characterized by a stark bifurcation between technologically elite early adopters and a vast segment of the market that remains anchored to legacy, analog workflows.
Empirical Adoption Metrics and the Trajectory of Implementation
Empirical survey data collected throughout 2025 and 2026 provides a highly nuanced picture of this technological divide. Broad industry surveys indicate that approximately 55% of construction companies have already implemented some form of AI-based software within their operational frameworks.4 However, when filtering for deep, workflow-integrated AI used for complex automation, problem-solving, or critical decision-making, the adoption rate narrows to 27% of AEC firms.2 While this lower bound suggests that a significant portion of the industry remains cautious, the trajectory of adoption is overwhelmingly aggressive among those who have successfully crossed the technological threshold. An estimated 94% of AEC companies currently utilizing advanced AI plan to substantially increase their investment over the next fiscal year, signaling a decisive shift from isolated pilot programs to comprehensive, enterprise-wide workflow integration.5 Companies such as Czinger and Divergent3d actively utilize 3d design for the bleeding edge of hypercar and aerospace development, but they are actively working towards making these solutions mass market.27
Furthermore, the enthusiasm for this technology is broadly recognized by industry leadership, with 74% of AEC executives viewing artificial intelligence as a strategic opportunity rather than a competitive threat.4 The financial commitment to this opportunity is robust; 61% of AEC leaders plan to increase their AI investment by more than 10% in the upcoming year.4 Interestingly, this rapid adoption is not strictly the domain of massive, multinational engineering conglomerates. Small AEC firms, defined as those operating with fewer than 50 employees, have demonstrated an astonishing 150% increase in AI tool usage since 2022, leveraging commercial off-the-shelf algorithms to compete with much larger entities.4
Sectoral disparities in adoption also reveal distinct infrastructural priorities. The North American market currently leads global AI adoption in AEC with a 35% global share.4 Within the various sub-sectors of construction, infrastructure projects account for 30% of all AI-integrated construction spend, driven heavily by complex civil engineering requirements.4 Conversely, AI adoption in the residential construction sector is lagging behind commercial development by approximately 18%, reflecting the differing scales of capital and complexity inherent in these distinct markets.4
The ROI Imperative and Workforce Mitigation
The return on investment (ROI) for these early adopters is not merely theoretical; it is mathematically quantifiable and highly disruptive to traditional firm economics. The data reveals that 68% of firms utilizing deep AI integration have realized cost savings exceeding $50,000 per project lifecycle.5 Furthermore, nearly half (46%) of these early adopters report reclaiming between 500 and 1,000 billable hours by automating highly complex, repetitive tasks such as quantity takeoffs, clash detection, and basic document generation.5 In specific applications, automated takeoff software has demonstrated the capacity to reduce estimating time by an astonishing 80%.4
Beyond direct cost savings, AI is functioning as a critical strategic lever to mitigate severe demographic and labor crises within the construction and engineering sectors. The industry is currently facing a deficit of approximately 439,000 workers.2 In response to this acute shortage, 56% of survey respondents explicitly state that AI helps to offset the skilled labor gap by drastically amplifying the productivity of their existing workforce.5 Furthermore, advanced digital tools are increasingly viewed as essential for recruitment, with 44% of firms citing access to cutting-edge technology as a key factor in attracting and retaining top-tier engineering and architectural talent, ranking alongside corporate culture and base compensation.5
The "Dark Data" Paradox and Integration Frictions
Despite the profound efficiencies and high satisfaction rates reported by early adopters, the industry faces severe friction in achieving universal, seamless AI integration. The primary barriers cited by AEC leaders are not entirely cultural; they are deeply infrastructural, regulatory, and related to data quality.
A comprehensive analysis of integration challenges reveals that data sharing security (42%) and overall cost and complexity (33%) are the primary operational bottlenecks preventing wider adoption.5 Furthermore, 69% of industry professionals indicate that paralyzing uncertainty regarding impending AI regulations and legal liabilities has actively slowed their implementation efforts.5 To navigate this complex legal and ethical landscape, 33% of AEC firms have already hired dedicated "AI Ethicists" or specialized consultants to ensure compliance with emerging data frameworks.4
The Persistence of Analog Workflows
Perhaps the most significant paradox within the 2026 AEC landscape is the coexistence of advanced digital aspirations alongside deeply entrenched analog realities. While firms are eager to adopt predictive digital twins and generative design algorithms, the foundational data required to train these models is often inaccessible. Astonishingly, 53% of survey respondents admit to still utilizing physical paper during the design phase, and 49% rely on paper during the planning phase.6 Furthermore, 43% of the industry continues to rely on physical signatures and manual approvals rather than cryptographic digital signatures.6
This heavy reliance on analog workflows creates a massive "dark data" problem. It is estimated that 80% of all data generated during an AEC project is never reused or analyzed post-construction.4 Because this data remains trapped in physical documents or unstructured, isolated digital silos, it cannot be utilized to train bespoke, firm-specific machine learning models. Consequently, 22% of AEC leaders explicitly identify the lack of high-quality, structured data as the single greatest barrier to their AI adoption.4 Firms that fail to digitize their foundational workflows cannot leverage historical project data to improve future cost estimations, leaving them at a severe disadvantage against competitors whose AI models can analyze past performance to improve estimation accuracy by 25%.4
Software Typologies: Probabilistic Models vs. Deterministic Realities
To accurately determine the necessary computational infrastructure for an AEC firm, one must deeply understand the specific nature of the AI tools being deployed. The AEC sector requires absolute mathematical precision and rigorous adherence to physical laws, making it uniquely hostile to the purely probabilistic nature of generalized Large Language Models (LLMs) and standard text-to-image diffusion generators.
The fundamental challenge of integrating generalized AI into AEC is the tension between probabilistic generation and deterministic physics.8 Generative AI models are essentially highly sophisticated mathematical engines designed to predict the next plausible token, word, or pixel based on vast training datasets.8 They do not possess a native, underlying understanding of 3D parametric space, nor can they execute true mathematical or structural calculations.8 If a structural engineer asks an LLM to verify the load-bearing capacity of a steel beam, the AI will confidently generate text that syntactically resembles a structural calculation. However, it is not actually calculating the load; it is hallucinating a statistically likely response based on linguistic patterns.8
In the architecture and engineering disciplines, a hallucination is not a mere inconvenience; it is an existential threat. A minor error in spatial coordination or material specification can result in catastrophic structural failure, massive liability lawsuits, and severe building code violations.8 Furthermore, architectural plans and engineering schematics must be rigorously reviewed, signed, and stamped by licensed professionals who carry heavy legal liability. Because an AI algorithm cannot hold a professional license, assume legal liability, or guarantee deterministic accuracy, its role is strictly relegated to that of an assistive tool rather than an autonomous agent.8
Specialized AI Workflows in the AEC Stack
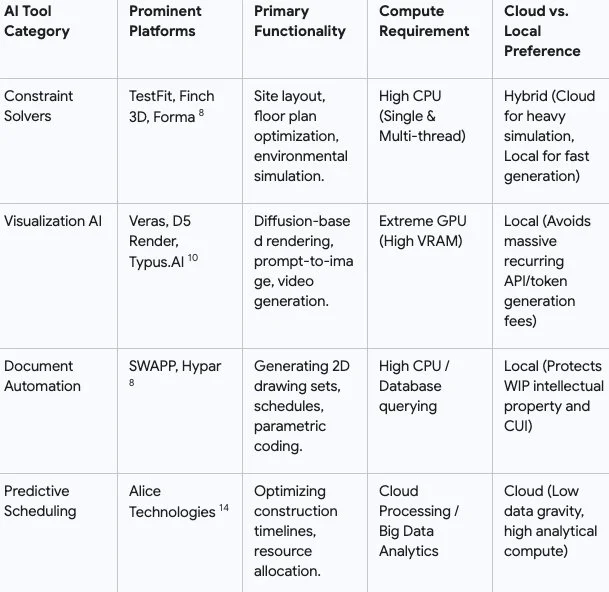
Because generalized models fail at deterministic physics, the AEC software market has evolved to produce highly specialized, task-specific computational tools. Understanding the processing requirements of these specific categories is critical for deciding whether to rely on cloud APIs or invest in local hardware workstations.
Feasibility, Massing, and Constraint Solvers
In the early stages of schematic design and site feasibility, tools like Autodesk Forma, TestFit, and Finch 3D dominate the landscape.8 TestFit, while frequently marketed under the umbrella of artificial intelligence, is more accurately defined as a highly sophisticated, real-time, rule-based constraint solver.8 It possesses the capability to generate up to 3,000 valid, code-compliant site plans—optimizing for complex variables like parking ratios and multi-family unit yields—in under 10 seconds on a standard machine.8
Similarly, Finch 3D utilizes advanced graph technology and generative algorithms to optimize residential floor plans within a predefined building envelope.8 Finch provides immediate, dynamic feedback on building performance metrics while ensuring that the generated outputs remain structurally reasonable, code-aware, and seamlessly integrated with parametric tools like Grasshopper.8 Autodesk Forma operates as a mature site and massing platform, running complex environmental simulations covering sun exposure, wind dynamics, noise pollution, and embodied carbon, subsequently connecting this data directly to Revit and Rhino.8 These feasibility tools are intensely computational, requiring substantial CPU resources to rapidly iterate through thousands of geometric permutations, though many leverage hybrid cloud-processing to offload heavy environmental simulations.
Visual Rendering and Diffusion Models
Generative AI has completely revolutionized architectural visualization, transitioning the industry from painstaking manual rendering to prompt-driven ideation. Applications such as Veras (acquired by Chaos), D5 Render, and Typus.AI utilize advanced diffusion models to generate photorealistic or highly stylized views directly from native BIM geometry.10
Veras, for example, integrates deeply with Revit, Rhino, SketchUp, and Vectorworks.10 It allows architects to lock in the deterministic 3D geometry of their model—using UI controls like "Geometry Override"—and use text prompts to explore material finishes, atmospheric lighting, and environmental contexts without ever leaving the BIM environment.10 The recent integration of the Nano Banana rendering engine has further extended Veras' capabilities to include AI-generated video, allowing designers to create short clips featuring dynamic camera pans and zooms.10 The computational burden for this workflow is extreme; generating high-resolution diffusion images and AI-upscaled videos requires massive GPU processing power and high VRAM capacity.
Document Automation and Generative Drafting
Drafting 2D construction documents remains the most labor-intensive and tedious phase of the AEC lifecycle. Innovative startups like SWAPP have emerged to attack this bottleneck by utilizing AI to automate construction documentation.8 SWAPP is designed to ingest a completed 3D BIM model and automatically generate highly detailed drawing sets, including sections, elevations, door schedules, and finish schedules.8 However, due to the rigid, bespoke nature of local building codes and the absolute necessity of human liability, the outputs generated by these automated drafting tools are not yet completely ready to be stamped and issued.8 They still require meticulous human oversight and manual annotation corrections, although they drastically reduce the raw hours spent on initial drafting workflows.8
Predictive Analytics, Scheduling, and Operations
Beyond the design phase, artificial intelligence is actively transforming construction management and physical site operations. Platforms such as Alice Technologies utilize AI-driven scheduling algorithms to optimize complex project timelines, resource allocation, and heavy equipment logistics.14 By analyzing millions of potential scheduling permutations, these systems can recover delayed timelines, optimize crane placement (reducing heavy lift time by 20%), and prevent an average of $500,000 in equipment downtime per large construction site through predictive modeling.4 Furthermore, 38% of engineering firms report using AI for predictive maintenance modeling, and energy optimization algorithms have been shown to lower operational building costs by 15% to 30%, with AI-powered HVAC controls specifically reducing energy consumption by up to 40% in commercial environments.4
By meticulously categorizing these tools, a clear infrastructural pattern emerges. Tasks burdened by high data gravity and intense graphical rendering (such as diffusion rendering, point cloud meshing, and massive document generation) heavily favor robust on-premise processing hardware to avoid exorbitant API fees and latency. Conversely, analytical tasks dealing with lightweight text, numerical data, and scheduling permutations can comfortably and economically remain on secure cloud servers.
The Data Gravity of Reality Capture and Point Clouds
The primary technological driver forcing AEC firms to reconsider their unquestioned reliance on cloud infrastructure is the phenomenon of "data gravity." As digital datasets grow exponentially in volume and complexity, they become increasingly difficult, time-consuming, and expensive to migrate across networks. This massive data mass exerts a gravitational pull, forcing the requisite applications and processing power to relocate closer to the physical data source. In the contemporary AEC sector, data gravity is almost entirely driven by the rapid proliferation of reality capture technologies, specifically terrestrial laser scanning, LiDAR, photogrammetry, and drone mapping.
The Staggering Scale of Spatial Datasets
Point cloud processing is widely acknowledged as one of the most hardware-intensive tasks within the entire AEC technology stack.16 A point cloud is not a simple 3D mesh or a solid CAD model; it is a dense collection of millions, or often billions, of individual measured data points in a three-dimensional space.16 Each individual point contains precise XYZ spatial coordinates, laser intensity values, and frequently RGB color data, collectively representing the exact physical surface geometry of an object, building, or topography.16
The raw data generated by these reality capture methods is staggering in its sheer volume. A single terrestrial laser scan session—perhaps capturing just a few rooms—can generate between 10 and 50 Gigabytes (GB) of raw data.16 When this process is extrapolated across a full building documentation project, a complex industrial facility, or a wide-scale infrastructure survey, the resulting datasets frequently measure in the hundreds of gigabytes, and occasionally extend into the terabyte range.16
Processing this data involves highly complex spatial indexing and algorithmic searching. When a software platform executes a registration algorithm or a cleaning tool, it must perform spatial queries (e.g., mathematically locating all points within a specific physical radius of a defined structural column).16 To execute these operations interactively and without system crashes, the entire dataset—or highly significant portions of it—must be loaded directly into the workstation's Random Access Memory (RAM).16 This architectural requirement creates an immense bottleneck for standard commercial workstations and introduces a critical, often fatal, latency issue for cloud-based virtual machines.
Hardware Specifications for Localized Spatial Processing
To process these massive spatial datasets locally with acceptable efficiency, AEC firms must invest in highly specialized, sovereign hardware architectures that vastly exceed consumer specifications. The processing of point clouds demands extreme memory capacity, rapid storage bandwidth, and highly capable GPUs for rendering billions of points simultaneously.
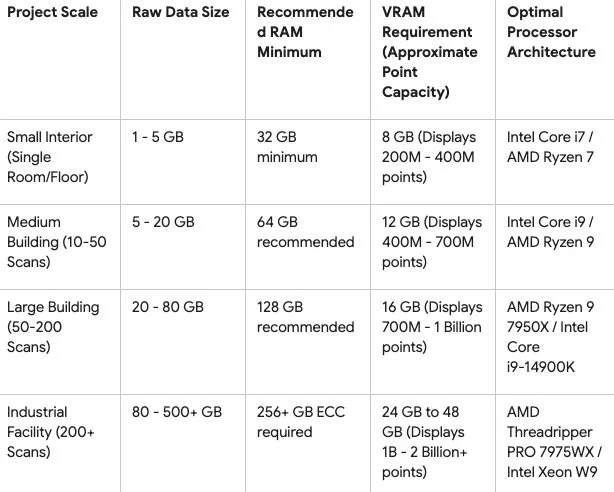
Data synthesized from comprehensive AEC hardware benchmarking and point cloud system requirements.16
The hardware specifications detailed above empirically demonstrate why remote cloud processing becomes a physical and economic liability for reality capture workflows. The general rule for point cloud processing dictates that a workstation's RAM should be at least twice the size of the largest working dataset.16 A firm regularly processing 40 GB point clouds requires an absolute minimum of 64 GB of RAM, though 128 GB provides a significantly more stable experience, as the operating system and the host software itself natively consume between 8 and 16 GB.16 A top-tier, industrial-scale workstation designed for these workloads requires 256 GB of DDR5 Error-Correcting Code (ECC) memory, an AMD Threadripper PRO CPU offering 8-channel memory bandwidth, and an NVIDIA RTX 4090 or professional RTX A6000 GPU to handle the interactive display of over two billion points.16
Furthermore, storage Input/Output (I/O) is frequently the most overlooked bottleneck in these systems. Point cloud files are heavily dependent on disk read/write speeds. Benchmarks prove that massive point cloud files load 5 to 10 times faster from a local PCIe Gen 4 or Gen 5 NVMe Solid State Drive (achieving read speeds exceeding 10,000 MB/s) than from a traditional SATA SSD, and 20 to 50 times faster than from a mechanical HDD.16
Attempting to execute this workflow on a remote cloud server introduces severe latency. Every rotation, pan, and zoom of a massive point cloud model requires continuous, real-time rendering. Pushing this dense graphical data from a cloud server to a local thin-client across a standard internet connection results in a degraded, lagging user experience that severely hampers productivity. Even in multi-user local environments where several team members access point cloud data from a central server, a 10 Gigabit Ethernet (10 GbE) network is considered the absolute practical minimum, as standard Gigabit Ethernet (1 GbE) is simply too slow for interactive spatial access.16
The Punitive Economics of Cloud Egress and Storage Rent
The immense data gravity of point clouds, coupled with the generation of high-fidelity AI renders and complex BIM models, transitions directly into the most critical financial argument against perpetual cloud reliance in the AEC sector: the punitive economics of data egress.
The Illusion of Cheap Cloud Onboarding
Cloud service hyperscalers—such as Amazon Web Services (AWS), Microsoft Azure, and Google Cloud Platform (GCP)—present an incredibly seductive initial proposition to AEC firms: zero upfront capital expenditure, highly managed infrastructure, and infinitely scalable storage. To incentivize adoption, these hyperscalers heavily subsidize the ingestion of data. Uploading terabytes of architectural models, LiDAR scans, and historical project data to the cloud is generally free or exceptionally cheap.
However, the economic trap of the cloud is triggered the moment an AEC firm attempts to actively retrieve, process, or migrate that data. This mechanism of wealth extraction is known as the data egress fee. In 2026, egress fees constitute a massive, and often entirely unanticipated, drain on AEC project profitability. Industry analyses confirm that cloud egress fees generally cost between 4 and 6 times more than the actual storage of the data itself.18
For a medium-to-large engineering firm actively collaborating on highly detailed 3D models, executing daily AI diffusion renders, and sharing massive point clouds, transferring 10 Terabytes (TB) of data out of the cloud over the course of a standard working month is a highly conservative estimate.
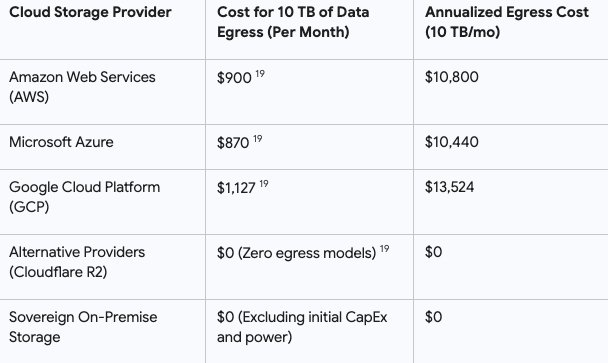
If an active firm scales its operations to 15 TB of egress per month on a platform like Azure, they face a staggering penalty of $1,665 monthly, translating to nearly $20,000 annually purely for the privilege of accessing their own data.18 When considering that major commercial or infrastructure AEC project lifecycles routinely span three to five years, the cumulative egress fees for a single project can easily exceed $100,000.
Total Cost of Ownership (TCO) and the Breakeven Velocity
By rigorously contrasting these continuous, compounding operational expenditures (OpEx) with the finite capital expenditure (CapEx) required to build sovereign hardware, a clear mathematical breakeven velocity emerges for the AEC enterprise.
A top-tier, industrial-scale AI workstation—equipped with a 32-core Threadripper PRO, 256GB of high-speed DDR5 RAM, 4TB of Gen 5 NVMe active storage, and a 24GB RTX 4090 GPU—costs approximately $15,000 to $20,000.16 If a firm relies heavily on cloud computing for iterative point cloud processing, continuous generative AI inference, and massive data sharing, the combined costs of virtual machine hourly rentals, AI API token consumption, and exorbitant data egress fees will mathematically eclipse the $20,000 hardware purchase price in less than 12 to 18 months.
Once the initial hardware CapEx is fully recovered, the on-premise infrastructure stabilizes into a predictable operational expenditure, operating at a marginal cost near zero (excluding electricity, cooling, and routine IT maintenance). This generates pure financial leverage for the firm over the hardware's standard four-to-five-year depreciation lifecycle. Therefore, for AEC firms consistently processing massive spatial datasets and generating high volumes of AI visual output, relying perpetually on the cloud is fundamentally an irrational destruction of enterprise capital.
The Regulatory Leviathan: Data Sovereignty and CMMC 2.0 Compliance
While the economic calculations regarding egress fees strongly favor the acquisition of on-premise hardware for high-throughput AEC tasks, the definitive and unyielding trigger forcing firms to repatriate their compute power is the rapidly evolving global regulatory landscape. In 2026, data sovereignty is no longer a peripheral IT concern or a theoretical best practice; it has calcified into an absolute contractual prerequisite for operating in the public, defense, and high-security private sectors.
CMMC 2.0 and the Protection of the Defense Industrial Base
For any AEC firm expecting to win, bid on, or participate as a subcontractor for projects funded by the United States Department of Defense (DoD), compliance with the Cybersecurity Maturity Model Certification (CMMC) 2.0 is an absolute, non-negotiable requirement.20
CMMC 2.0 is the measurement standard the government utilizes to enforce structure and rigorous oversight protocols for the handling and safeguarding of Controlled Unclassified Information (CUI) within the Defense Industrial Base (DIB).20 In the specific context of the construction and engineering industry, CUI is not limited to classified military weapon secrets. It encompasses a vast, sweeping array of standard project documentation. Architectural blueprints, structural specifications, as-built point clouds, site organizational charts, Requests for Information (RFIs), submittals, vendor emails, and facility management models for military barracks, federal courthouses, or critical national infrastructure are all legally classified as CUI or Federal Contract Information (FCI).20
The implementation of the CMMC 2.0 framework is occurring in strict, legally binding phases.22 By 2026, the industry has fully entered Phase 2, which radically alters the compliance landscape.22
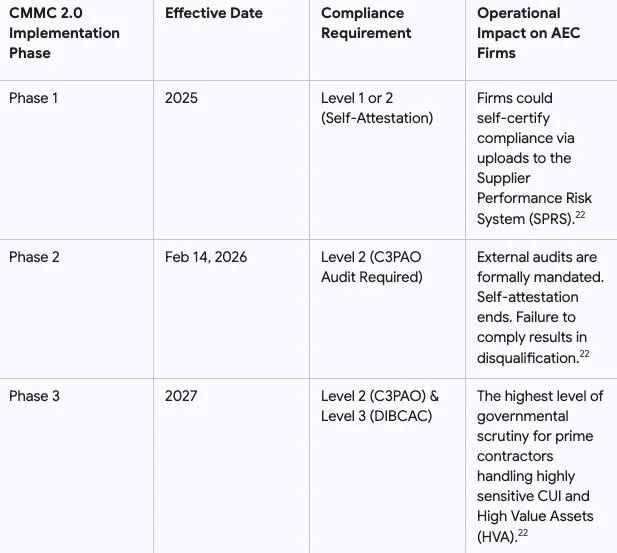
Crucially, CMMC compliance contains strict "flow-down" rules.20 This dictates that if a massive prime contractor secures a DoD construction contract, every single subcontractor, engineering consultant, specialized trade worker, and material supplier that touches the CUI must also be CMMC certified to the requisite level specified in the contract.20
This federal regulatory framework directly and forcefully impacts the strategic decision between cloud computing and on-premise hardware. Utilizing standard, multi-tenant public cloud AI tools (such as public web instances of ChatGPT, commercial Midjourney accounts, or non-compliant cloud BIM platforms) to process, analyze, or generate CUI is a severe violation of federal law. Cloud providers hosting this defense-related data must hold a minimum of FedRAMP Moderate Equivalency.20
Because navigating and licensing FedRAMP-compliant sovereign clouds (such as AWS GovCloud or Microsoft GCC High) is exceptionally expensive, disruptive, and technically complex—often requiring significant IT resources that smaller AEC firms lack—many organizations find that building air-gapped, sovereign, on-premise AI workstations is the most secure, legally defensible, and cost-effective method of guaranteeing absolute data sovereignty.21 By keeping sensitive blueprints and models entirely on local servers, firms effortlessly mitigate the risk of data leakage, protect their Supplier Performance Risk System (SPRS) scores, and seamlessly achieve CMMC Level 2 certification, thereby preserving their eligibility for highly lucrative federal contracts.
Information Governance: ISO 19650 and OpenBIM Standards
Beyond the specific requirements of United States federal defense contracts, the broader global AEC market is increasingly governed by ISO 19650, the internationally recognized standard for information management over the entire lifecycle of a built asset using BIM.24 ISO 19650 fundamentally rejects chaotic, ad-hoc file sharing, isolated data silos, and "Lonely BIM" practices, mandating instead a highly disciplined Common Data Environment (CDE) that acts as the single, agreed-upon source of truth for all project information.24
The Strict States of the Common Data Environment (CDE)
To achieve compliance with ISO 19650, an AEC firm's computational infrastructure must support the strict management of information containers as they transition through four rigorously defined states 24:
Work in Progress (WIP): Data is actively being developed by a specific authoring team (e.g., the structural engineering department). This data is strictly internal and must absolutely not be visible to or accessible by external project stakeholders or other disciplines.
Shared: Data is passed through a formal approval gate and shared with other disciplines for coordination, clash detection, and review.
Published: The final, verified information that has been formally authorized for construction, procurement, or contractual delivery.
Archive: A secure, immutable, and traceable record of all project data retained for legal compliance, audit trails, and future digital twin operations.
Public cloud AI platforms fundamentally disrupt and violate the WIP state. When an architect feeds a preliminary, unapproved design model into a public generative AI platform hosted on the cloud to explore stylistic variations or optimize floor plans, they are actively exposing unapproved WIP data to an external server environment. This action completely circumvents the strict state transitions, formal approval gates, and role-based responsibilities (Author, Checker, Approver) mandated by ISO 19650.24
Furthermore, ISO 19650 demands strict identification schemas, requiring unique IDs, systematic classification, and naming conventions that must be rigidly validated upon file upload.24 To maintain compliance, firms must either utilize highly specialized, pre-configured CDE platforms (such as Revizto, or SharePoint environments augmented by compliance applications like Flinker) 24, or they must utilize localized, on-premise generative AI tools.
By running AI inferencing locally on physical workstations, the firm maintains absolute sovereignty over its WIP containers. This guarantees that unvetted, AI-generated design variations do not accidentally propagate into the Shared or Published states without formal, documented human verification gates. It also aligns perfectly with the core principles of OpenBIM, an approach championed by buildingSMART, which emphasizes interoperability, vendor neutrality, and data sovereignty via open standards like Industry Foundation Classes (IFC) and BIM Collaboration Format (BCF).26 Operating local hardware allows AEC firms to interact with open formats without being forced into the proprietary, closed-ecosystem clouds of single software vendors, preventing vendor lock-in and ensuring data longevity across the decades-long lifespan of a built asset.26
Managing Capital Risk in a Hyper-Accelerated Hardware Cycle
A primary strategic argument frequently deployed against heavy capital expenditure in on-premise hardware is the fear of rapid technological obsolescence. Historically, enterprise server components and CAD workstations were reliably depreciated over a comfortable five-to-seven-year operational horizon. However, in 2026, the artificial intelligence sector is experiencing an unprecedented and violently disruptive acceleration in semiconductor development.
The undisputed global leader in AI compute acceleration, NVIDIA, has aggressively shifted from a traditional biennial architectural release schedule to a blistering one-year cadence. The market dynamics of this acceleration are staggering. The transition from the Hopper architecture (H100/H200) to the Blackwell platform (B200) brought a massive 4x increase in inference throughput, only to be almost immediately superseded by the announcement of the next-generation Vera Rubin platform. The Rubin architecture promises 5x greater performance than Blackwell and features an overwhelming 288GB of advanced HBM4 memory bandwidth.
This hyper-accelerated cycle induces a severe "Osborne Effect" within IT procurement departments—a market phenomenon where firms completely paralyze their purchasing processes, delaying necessary hardware upgrades out of the acute fear that currently available technology will be rendered mathematically obsolete within a matter of months. For an AEC Chief Technology Officer, investing hundreds of thousands of dollars into a cluster of Blackwell workstations in early 2026 presents a terrifying risk of capital destruction if the Rubin architecture is slated for imminent deployment.
Decoupling Foundation Training from the Inference Long Tail
To safely navigate this severe capital allocation risk, AEC executive committees must deeply understand the economic concept of the "inference long tail" and strictly decouple the two highly distinct phases of AI workloads: model training versus model inference.
Training a new, frontier foundation model requires the continuous operation of thousands of cutting-edge GPUs processing petabytes of data for weeks or months. This computationally immense task is strictly the domain of hyperscalers and base-model developers.11 Conversely, the daily operational output of an AEC firm consists almost entirely of inference—the localized, real-time application of a pre-trained model to a specific task. This includes rendering an architectural scene via Veras, solving a massing constraint via TestFit, analyzing a contract via Natural Language Processing (NLP), or indexing a point cloud.
Older hardware architectures maintain exceptional utility, speed, and financial viability for these inference tasks. A workstation equipped with an RTX 4090 or a professional ADA generation GPU may no longer represent the absolute frontier of semiconductor physics, but it remains incredibly fast and perfectly capable of executing AEC-specific inference workflows for up to six years. The physical capacity of the hardware to generate billable value does not degrade merely because a faster chip exists on the global market.
By applying localized token economics, AEC firms can calculate their internal breakeven horizon. If a mid-sized architecture firm utilizes local hardware to generate 500 AI renders a week, process 20 large point clouds a month, and automate the drafting of dozens of document sets, they can easily quantify the exact cost of executing those identical tasks on the cloud via API consumption and egress fees. If that cloud cost recovers the capital price of a local hardware workstation in four to six months, the threat of a newer, faster chip launching in eight months becomes entirely irrelevant. The hardware effectively pays for itself rapidly, mathematically nullifying the risk of capital destruction, and smoothly transitions into a state of generating pure profit capacity for the remainder of its physical lifespan.
Synthesis and Strategic Recommendations
The strategic decision between relying on ubiquitous cloud-based AI infrastructure and investing heavily in sovereign, on-premise hardware represents a defining operational crossroad for the AEC sector in 2026. Analyzed through the lens of empirical adoption rates, data physics, punishing cloud economics, and draconian regulatory frameworks, it is evident that a blanket reliance on public cloud infrastructure is no longer economically sustainable or legally defensible for firms operating at the frontier of digital construction.
To maintain a competitive advantage, preserve profit margins, and ensure institutional survival, AEC leadership must adopt the following strategic posture:
Repatriate High-Gravity Workloads: The laws of data gravity remain absolute. The staggering size of point cloud data and digital twins—frequently exceeding 100 GB per project—makes continuous cloud uploading, downloading, and network rendering economically ruinous.16 AEC firms must invest in local, high-RAM (128GB to 256GB ECC) and high-VRAM (16GB to 24GB+) workstations to process reality capture data locally. Doing so completely eliminates the crippling data egress fees charged by hyperscalers, which can easily exceed $10,000 annually for a mere 10 TB of monthly transfer.16
Mandate Sovereign Infrastructure for Defense and Regulatory Compliance: With the strict enforcement of CMMC 2.0 Phase 2 in 2026, the era of lax data security in federal contracting is decisively over.22 AEC firms handling architectural blueprints, structural diagrams, and project schedules for government contracts are legally handling Controlled Unclassified Information (CUI).21 Exposing this data to multi-tenant public AI platforms is a direct violation of federal law. Firms must establish air-gapped, sovereign AI hardware ecosystems to secure their data, maintain their SPRS scores, and remain eligible for highly lucrative DoD bids.20
Align Generative AI Workflows with ISO 19650 Standards: The integration of AI must not disrupt the strict Common Data Environment (CDE) state transitions mandated by global ISO 19650 standards.24 Unvetted, AI-generated outputs must remain rigidly confined to the internal Work in Progress (WIP) state.24 Localized AI processing ensures that proprietary design permutations are mathematically shielded from external exposure until human architects formally approve their transition to the Shared and Published states.
Deploy Specialized, Deterministic Assistive AI: AEC leaders must recognize and accept the inherent limitations of generalized LLMs. Because AI models are probabilistic engines mathematically incapable of deterministic physical calculation, they cannot hold professional liability, stamp drawings, or independently verify structural integrity.8 Consequently, capital should be strategically allocated toward highly specialized, localized assistive tools—such as Veras for diffusion rendering, SWAPP for automated documentation drafting, and TestFit for complex constraint solving.8
Mitigate the Osborne Effect via Accelerated ROI: AEC firms must not allow the aggressive 1-year semiconductor release cycle to paralyze their IT procurement strategies. By completely decoupling foundational AI training from daily operational inference, firms can leverage the prolonged utility of the "inference long tail." If the local generation of architectural renders, automated documents, and point cloud meshes yields operational savings that offset the initial hardware CapEx in a matter of months, the hardware investment is mathematically justified, regardless of impending architectural releases from hardware manufacturers.
Ultimately, the AEC firms that will dominate the remainder of the decade are those that adopt a highly sophisticated, hybrid computational posture. They will leverage secure, federated cloud environments exclusively for lightweight predictive scheduling, big data analytics, and inter-disciplinary communication, while aggressively deploying massive, sovereign on-premise compute clusters to dominate the heavy-gravity realms of generative visualization, reality capture, and secure defense contracting. Those who fail to internalize their most intensive computational workloads will find their project margins continuously eroded by perpetual cloud rent, their operational agility crippled by network bandwidth latency, and their institutional integrity irrevocably compromised by an inability to secure their proprietary digital assets.
-
The 2026 AEC Technology: BIM, AI, & Digital Twins - Tesla Outsourcing Services, accessed May 27, 2026, https://www.teslaoutsourcingservices.com/blog/the-2026-aec-technology-bim-ai-digital-twins/
2025 AEC Tech Industry Research Report, accessed May 27, 2026, https://www.aechub.org/insights/aec-tech-research-report-2025
Top Computational Design Trends Transforming the AEC Industry in 2026 - STRUCTUREX, accessed May 27, 2026, https://structurex.live/top-computational-design-trends-transforming-the-aec-industry-in-2026/
100+ AI In The Aec Industry Statistics | 2026 Data Report - WifiTalents, accessed May 27, 2026, https://wifitalents.com/ai-in-the-aec-industry-statistics/
New Bluebeam Report Shows Early AI Adopters in AEC Seeing ..., accessed May 27, 2026, https://press.bluebeam.com/2025/10/new-bluebeam-report-shows-early-ai-adopters-in-aec-seeing-significant-roi-despite-uneven-adoption/
Architecture, engineering, construction sector slow to adopt AI, survey shows - ASCE, accessed May 27, 2026, https://www.asce.org/publications-and-news/civil-engineering-source/article/2025/12/18/architecture-engineering-construction-sector-slow-to-adapt-ai-survey-shows
If digitalisation is here, why do half of UK construction firms still depend on paper?, accessed May 27, 2026, https://www.constructionbriefing.com/news/if-digitalisation-is-here-why-do-half-of-uk-construction-firms-still-depend-on-paper/8087847.article
Why AI Isn't Disrupting the Design Process in AEC Yet | e-verse, accessed May 27, 2026, https://e-verse.com/learn/why-ai-isnt-disrupting-the-design-process-in-aec-yet/
tankvn/awesome-ai-tools - GitHub, accessed May 27, 2026, https://github.com/tankvn/awesome-ai-tools
Veras - AI Spotlight Directory - AEC Magazine, accessed May 27, 2026, https://aidirectory.aecmag.com/entry/veras/
AI in AEC: A Company Guide - Motif, accessed May 27, 2026, https://www.motif.io/blog/ai-in-aec
Top 8 Best AI SketchUp Plugins Every Architect Needs in 2026 - D5 Render, accessed May 27, 2026, https://www.d5render.com/posts/best-ai-sketchup-plugins-2026
Chaos: from pixels to prompts - AEC Magazine, accessed May 27, 2026, https://aecmag.com/features/chaos-from-pixels-to-prompts/
AI Preconstruction Project Scheduling Software - ALICE Technologies, accessed May 27, 2026, https://www.alicetechnologies.com/product/preconstruction
AI Construction Scheduling: From Reactive to Predictive | Dan, accessed May 27, 2026, https://dancumberlandlabs.com/blog/ai-construction-scheduling/
Point Cloud Processing Hardware Guide | THE FUTURE 3D, accessed May 27, 2026, https://www.thefuture3d.com/blog/point-cloud-processing-hardware-requirements
3D point cloud | usBIM - ACCA software, accessed May 27, 2026, https://www.accasoftware.com/en/3d-point-cloud
What Are Egress Fees? The 2026 Data Engineer's Guide - Akave Cloud, accessed May 27, 2026, https://akave.com/blog/what-are-egress-fees-the-complete-guide-for-data-engineers
Cloud Egress Cost, accessed May 27, 2026, https://egresscost.com/
What is CMMC Compliance Today? - Infor, accessed May 27, 2026, https://www.infor.com/industries/aerospace-defense/what-is-cmmc-compliance
CMMC Compliant Construction Software - Kahua, accessed May 27, 2026, https://www.kahua.com/security/cmmc/
CMMC: Contractor Data Requirements on DOD Projects - Procore, accessed May 27, 2026, https://www.procore.com/library/cmmc-contractor-data-requirements
The Leading CMMC Compliance Solution - PreVeil, accessed May 27, 2026, https://www.preveil.com/cmmc-compliance/
ISO 19650 and SharePoint: Making Your Project Data Room ..., accessed May 27, 2026, https://flinker.app/blog/iso19650-sharepoint-cde/
Blog - BIM standards explained: ISO 19650, LOD levels, and BIM maturity in 2026 - Revizto, accessed May 27, 2026, https://revizto.com/resources/blog/bim-standards-level-of-information-bim
Open BIM - Catenda, accessed May 27, 2026, https://catenda.com/glossary/openbim-definition/
Behind the scenes of America's 3D-printed hypercar: Czinger | Capturing Car Culture w/ Larry Chen - Hagerty, accessed May 27, 2026, https://www.youtube.com/watch?v=te3FMxRnioo&t=4322s

Empirical Evaluation of Capacity-Based Monetary Theory: An Econometric and Case-Study Framework
1. The Ontology of Value and the Theoretical Architecture of Money
For centuries, the fundamental question of what constitutes money has challenged economists, jurists, and philosophers. The standard tripartite definition found in introductory macroeconomic texts—that money functions as a medium of exchange, a unit of account, and a store of value—describes the functional symptoms of moneyness, but it profoundly fails to explain what money is in an ontological sense.[1] In the complex double-entry bookkeeping of modern civilization, fiat money appears as a liability on the balance sheet of the sovereign state. By fundamental accounting principles, a liability cannot exist in a vacuum; it must be balanced by a corresponding asset. Capacity-Based Monetary Theory (CBMT) posits that the asset backing the liability of fiat money is not gold, nor the mere coercive decree of the state, but rather the Expected Future Impact of the society that issues it.[1]
Under this theoretical architecture, money is rigorously redefined as a floating-price claim on the future productive capacity of an economy.[1] This capacity is not a static hoard of physical wealth or foreign currency reserves, but a dynamic vector function driven by three primary variables: the aggregate labor of the population, the efficiency of that labor as amplified by technology and human capital, and the stability of the institutional social contract that allows this labor to project value safely into the future.[1] When a market participant accepts a currency in exchange for goods or services today, they are effectively acquiring a call option on the future labor and institutional stability of that society.[1] They are making a calculated bet that the society will possess the physical and institutional capacity to redeem that claim for real value at a later date, essentially extending Adam Smith's concept of "Labor Commanded" into the realm of modern fiat derivatives.[1]
If the money supply remains constant while the underlying capacity to produce real output expands, the purchasing power of the currency increases, manifesting as deflation. Conversely, if the structural capacity degrades or the institutional framework collapses while the claim structure remains fixed, the value of the claim is inherently diluted, manifesting as inflation or severe exchange-rate depreciation.[1] To validate this paradigm empirically, it is necessary to move beyond standard monetarist equations that focus exclusively on the velocity and supply of money. A comprehensive empirical evaluation requires rigorous econometric testing of CBMT’s core axioms. By regressing inflation and exchange-rate depreciation on lagged changes in capacity variables—specifically human capital, physical capital, and governance indices—against the backdrop of broad money growth, the core tenets of CBMT can be subjected to robust quantitative analysis.
2. Theoretical Parameters and Mathematical Foundations
To construct an empirical architecture capable of testing this theory, the theoretical parameters of CBMT must first be mathematically operationalized. The framework synthesizes insights from Production Theory, Human Capital Theory, Institutional Jurisprudence, and Evolutionary Signaling to create a comprehensive model of macroeconomic value.[1]
2.1 The Augmented Solow-Swan Production Engine and Human Capital
The starting point for quantifying the underlying collateral of a modern currency is the Augmented Solow-Swan growth model, specifically the specification pioneered by Mankiw, Romer, and Weil (MRW).[1] The standard neoclassical Solow model is insufficient for monetary valuation because it treats labor merely as a fungible headcount. To accurately model the dynamic asset backing a currency, the MRW specification treats Human Capital as an independent factor of production with its own unique accumulation and depreciation dynamics.[1]
The theoretical production function for total "Impact" or real output, which serves as the underlying collateral, is defined as:
$$Y_t = K_t^\alpha H_t^\beta (A_t L_t)^{1-\alpha-\beta}$$
Within this equation, total output is determined by the stock of physical capital, the stock of human capital representing skills, education, and health metrics, the aggregate labor force, and the labor-augmenting technology or efficiency capacity.[1] The exponents represent the elasticities of output with respect to physical and human capital, implying diminishing returns to capital accumulation.[1]
In the context of CBMT, this specification is critical because it demonstrates that a currency’s strength depends not merely on demographic expansion, but on the continuous investment rate required to maintain the stock of human capital. Unlike a simple multiplier, human capital is a distinct asset class that depreciates over time and requires constant replenishment.[1] Drawing upon Gary Becker’s micro-foundations regarding the allocation of time, individuals combine market goods and their own time to produce this impact.[1] Consequently, a currency backed by a population with advanced education represents a claim on a vastly larger pool of potential future impact. This mathematical reality explains why shrinking populations in advanced economies can sustain extraordinarily strong currencies; if the accumulation of human capital and technological efficiency outpaces the decline in demographic headcount, the total capacity backing the currency continues to grow.[1]
2.2 Institutional Realization, Transaction Costs, and the Hobbesian Trap
Theoretical physical capacity is rendered economically meaningless if the fruits of labor cannot be secured across time. Drawing heavily on the institutional economics of Douglass North, CBMT acknowledges that transaction costs in an economy are never zero, and the formal rules and informal constraints of a society dictate the feasibility of engaging in economic activity.[1, 2, 3] In the absolute absence of a stable social contract—a condition Thomas Hobbes famously described as the "state of nature" where life is solitary, poor, nasty, brutish, and short—transaction costs effectively approach infinity.[1] In such a Hobbesian state, money cannot exist because the forward discount rate is infinite; no rational economic agent would exchange a tangible good today for a token promising a good tomorrow if tomorrow guarantees expropriation or violence.[1]
To account for this institutional constraint empirically, CBMT introduces the Institutional Realization Rate, a coefficient bounded between zero and one that dictates how much of an economy's theoretical production capacity actually remains on the sovereign state's balance sheet.[1] This rate is micro-founded on an Institutional Arbitrage Ratio, which measures the competing transaction costs a population faces between operating within the formal legal structure versus the informal shadow economy.[1]
When formal inclusive institutions provide a surplus of utility, the costs of regulatory compliance and taxation are lower than the costs of shadow-market alternatives, such as mafia protection or the risk of imprisonment. In this high-trust scenario, theoretical capacity is fully realizable, and the institutional realization rate approaches one.[1] However, when an extractive government over-regulates, becomes profoundly corrupt, or loses its monopoly on violence, the transaction costs of the formal market exceed the costs of the shadow market.[1] In response, human capital and aggregate labor rationally migrate into the untaxed, unregulated informal economy. Because this diverted capacity can no longer be collateralized or taxed by the state, the currency effectively loses its underlying asset backing, causing the realization rate to collapse toward zero and triggering severe currency depreciation regardless of the central bank's monetary policy.[1]
2.3 Evolutionary Signaling and the Pricing of Regime Risk
If money is fundamentally a claim on capacity, market participants require mechanisms to identify high-capacity agents and stable institutional regimes. CBMT resolves this through the integration of Signaling Theory, specifically Amotz Zahavi’s Handicap Principle and Thorstein Veblen’s theories of conspicuous consumption.[1] In labor and capital markets, signals are only effective if they are differentially costly. The burning of capital—such as exorbitant sovereign infrastructure projects or the agglomeration premiums paid to enter elite economic hubs—acts as a proof of surplus capacity.[1] By setting high costs of entry, economic networks guarantee assortative mating and high talent density, mirroring Michael Kremer’s O-Ring Theory of Economic Development where high-skill workers cluster to prevent the catastrophic destruction of value chains by low-skill errors.[1]
However, the valuation of a currency is ultimately subject to stochastic shocks and sudden shifts in these signals. Traditional deterministic models fail to capture the sudden breakdown of the social contract. To accurately price the risk of institutional collapse, CBMT employs the Hamilton Filter, a Markov regime-switching algorithm designed to estimate discrete regime shifts in time series data.[1, 4, 5] The fundamental value of money is dependent on the probability of the economy being in a specific unobserved state, such as a stable institutional order versus a Hobbesian collapse.[1, 6] A sudden spike in inflation or exchange rate depreciation is frequently the market's instantaneous updating of the probability of a collapse regime.[1] Even before the money supply increases significantly, if the Hamilton Filter detects a shift in the transition matrix suggesting the state is losing control, the forward discount rate spikes, and the value of money plummets.[1]
3. Econometric Architecture and Analytical Specifications
To subject the Capacity-Based Monetary Theory to rigorous empirical evaluation, an econometric architecture must be constructed that models the dynamic, long-term relationships between inflation, exchange-rate depreciation, and the lagged components of the production function and the institutional realization rate.
3.1 Dynamic Panel Data Models: Resolving Endogeneity via System-GMM
Analyzing macroeconomic determinants across diverse global economies requires advanced dynamic panel data models. Because capacity variables like human capital accumulation and institutional quality evolve slowly and exert persistent, long-term effects on economic output and inflation, standard static Ordinary Least Squares regressions are highly susceptible to endogeneity, omitted variable bias, and reverse causality.[7, 8, 9] For instance, while poor institutional quality and weak human capital inevitably cause inflation, severe inflation and currency crises equally destroy institutional trust and incentivize the emigration of skilled labor.[9, 10]
To resolve these econometric challenges, the empirical strategy necessitates the Generalized Method of Moments, specifically the System-GMM estimator developed by Arellano and Bover (1995) and Blundell and Bond (1998).[9, 11, 12] Taking first-differences eliminates cross-country variation, allowing researchers to study the effect of changes over time within countries. However, because human capital and government effectiveness are highly persistent over time, lagged levels of these variables function as weak instruments for equations in differences.[13] The System-GMM estimator corrects this by combining the regression in first-differences with the regression in levels, instrumenting the endogenous explanatory variables with their own suitably lagged values to ensure orthogonal error terms.[9, 13]
The baseline dynamic panel regression equation for inflation or exchange rate depreciation can be specified as:
$$\pi_{it} = \alpha_i + \rho \pi_{i, t-1} + \beta_1 \Delta \ln(H_{i, t-k}) + \beta_2 \Delta \ln(I_{i, t-k}) + \beta_3 \Delta \ln(M_{i, t}) + \gamma X_{it} + \mu_t + \epsilon_{it}$$
Within this specification, the dependent variable represents either the inflation rate or the rate of currency depreciation for a given country at a given time. The lagged stock of human capital requires lag structures of five to ten years, as educational and skill investments require considerable time to enter the active labor force and shift the aggregate production frontier.[14] The lagged institutional quality index serves as the empirical proxy for the institutional realization rate, while broad money supply growth functions as the denominator of claims. A vector of control variables, such as terms of trade, demographic dependency ratios, and trade openness, must be included alongside country-specific fixed effects and global time shocks.[15, 16, 17]
3.2 Asymmetric Threshold Effects and Nonlinear ARDL Models
CBMT explicitly posits that the relationship between capacity, institutions, and currency value is highly non-linear. The market generally tolerates minor bureaucratic inefficiencies, but a complete breakdown of trust fundamentally severs the currency from its asset backing, triggering an exponential collapse. Empirical research widely supports this threshold effect; studies indicate that economic growth and price stability have a much stronger association with human capital only when institutional governance falls above a critical estimated threshold.[18] Below a minimum level of institutional quality, the stabilizing relationship between human capital and inflation breaks down entirely, as the state lacks the capacity to formalize and capture the value generated by its citizens.[11]
To capture this mathematically, the econometric design must incorporate threshold regression models or specific interaction terms. An interaction term between human capital and institutional quality can effectively isolate the synergistic effect between workforce capability and the prevailing legal environment.[9, 15] Furthermore, analyzing the asymmetric pass-through of these variables requires Nonlinear Autoregressive Distributed Lag (N-ARDL) models.[19, 20] The N-ARDL approach allows researchers to decompose the institutional variables into positive and negative partial sums, revealing that the degradation of institutional trust weakens a currency much faster and more violently than the accumulation of human capital strengthens it.[19, 20]
3.3 The Hamilton Filter: Markov Regime-Switching and Probability of Collapse
To empirically capture the sudden evaporation of value predicted by CBMT during a Hobbesian collapse, the standard linear regression framework must be augmented with the Hamilton Filter.[4, 6] The Markov-switching model assumes that the parameters of the data generating process shift abruptly when an underlying, unobservable state variable shifts.[6]
By defining two distinct states—an expansionary state of institutional stability and a recessionary state of institutional failure—the model recursively estimates the probability of the unobserved state using prediction and update steps based on observed macroeconomic data.[1, 21] The densities under the two regimes capture the vastly different variance and correlation patterns of inflation and currency valuation during a crisis.[21, 22] This probabilistic framework proves essential for modeling emerging market currencies, where the shift from a stable peg to hyperinflationary freefall is governed by sudden changes in transition probabilities rather than smooth, linear deterioration.[1, 5]
4. Data Topography and Empirical Proxies
The robust econometric evaluation of CBMT relies inherently on selecting precise, high-fidelity empirical proxies for the variables outlined in the theoretical architecture. The required datasets must bridge multiple disparate domains, combining national macroeconomic aggregates with complex human capital indices and subjective institutional perceptions.
4.1 Human Capital Indexing: Penn World Table and World Bank HCI
Historically, macroeconomic models relied on rudimentary metrics such as adult literacy rates or primary school enrollment to proxy human capital. These crude measures universally fail to capture the actual productive quality and technical efficiency of the modern workforce.[23] Modern econometric testing of CBMT requires sophisticated, quality-adjusted indices.
The primary data source for the human capital variable is the Penn World Table (PWT) Version 11.0, an exhaustive database providing information on relative levels of income, output, inputs, and productivity covering 185 countries from 1950 to 2023.[24, 25, 26] Crucially, the PWT constructs its Human Capital Index by combining the average years of schooling from the Barro-Lee educational attainment dataset with an assumed rate of return to education derived from Mincer equation estimates.[26, 27, 28, 29] This methodology perfectly captures the Beckerian assertion that labor is accumulated capital, allowing researchers to accurately assess the growth of the productive collateral backing a currency over a 70-year horizon.[1, 30]
To provide complementary depth, researchers should also utilize the World Bank Human Capital Index (HCI), which provides continuous data from 2000 to 2024.[31, 32] The HCI employs a slightly different methodology, measuring the exact amount of human capital a child born today can expect to attain by age 18, rigorously factoring in health variables, survival rates, and learning-adjusted years of schooling.[31] Integrating both the historical depth of the PWT and the forward-looking health adjustments of the World Bank HCI provides a comprehensive view of current workforce capability versus expected future capacity.
4.2 Institutional Trust and Governance: The World Bank WGI
Quantifying the Hobbesian constraints, social contract stability, and transaction costs outlined by Douglass North is notoriously difficult because institutional trust is an inherently unobservable phenomenon.[2, 3] Consequently, researchers must rely on sophisticated perceptual aggregation.
The World Bank's Worldwide Governance Indicators (WGI) project serves as the optimal dataset for this parameter, offering annual composite indicators for over 200 economies spanning from 1996 to 2024.[33] The WGI methodology aggregates perception data from 35 distinct cross-country sources, including household surveys, firm surveys, and expert assessments provided by multilateral organizations and commercial data providers.[34, 35, 36] The dataset compiles these perceptions across six core dimensions: Voice and Accountability, Political Stability and Absence of Violence, Government Effectiveness, Regulatory Quality, Rule of Law, and Control of Corruption.[33, 37] Within the CBMT framework, the Rule of Law and Government Effectiveness sub-indices serve as ideal empirical proxies for the inverse of formal institutional transaction costs, directly mapping to the state's capacity to maintain order and enforce property rights.
4.3 Shadow Economy Metrics: The Medina-Schneider MIMIC Database
While the WGI measures the subjective perception of institutions, the size of the shadow economy directly measures the behavioral reality of the Institutional Arbitrage Ratio. If citizens and firms rationally migrate to the informal sector to avoid extractive regulatory environments or corrupt formal structures, this unrecorded productive capacity cannot back the sovereign's currency, causing the institutional realization rate to plummet.[1, 38]
The Medina and Schneider global shadow economy dataset (1991-2017) provides exhaustive estimates of the shadow economy as a percentage of official GDP for 158 countries.[39, 40] The methodology avoids the endogeneity of relying solely on official GDP figures by employing a Multiple Indicators Multiple Causes (MIMIC) approach.[39, 41, 42] The model utilizes physical and monetary indicators, such as the Currency Demand Approach and satellite night-light intensity data, to accurately gauge unrecorded economic activity.[39, 41, 42, 43] Incorporating this dataset into the regression framework directly tests the CBMT axiom that high levels of shadow economic activity inherently trigger currency weakness by shrinking the effective tax and collateral base of the sovereign state.
4.4 Macroeconomic Aggregates: IMF World Economic Outlook
The dependent variables for the econometric models—inflation and exchange-rate depreciation—alongside the primary control variable of broad money supply growth, are to be extracted from the International Monetary Fund’s World Economic Outlook (WEO) database.[44, 45] The WEO provides standardized, biannual data on average consumer price inflation, end-of-period exchange rates, implied PPP conversion rates, current account balances, and general government gross debt from 1980 through current projections.[46, 47] This provides the necessary dependent variable variance to map against the independent capacity metrics across diverse global regimes.
| CBMT Theoretical Variable | Econometric Function | Primary Empirical Proxy Dataset | Date Coverage |
|---|---|---|---|
| Human Capital | Production Capacity Modifier | Penn World Table (PWT) 11.0; World Bank HCI | 1950-2023; 2000-2024 |
| Institutional Trust | Formal Transaction Cost Proxy | World Bank Worldwide Governance Indicators (WGI) | 1996-2024 |
| Realization Rate | Arbitrage Reality | Medina-Schneider Shadow Economy MIMIC Database | 1991-2017 |
| Inflation / Exchange Rate | Dependent Variables | IMF World Economic Outlook (WEO) | 1980-2031 |
| Money Supply | Denominator of Claims | IMF WEO / International Financial Statistics (IFS) | 1980-2031 |
5. Case Studies: Exogenous Shocks and Institutional Decay
While large-N dynamic panel regressions identify long-term structural trends and steady-state relationships, exogenous shocks provide clean quasi-natural experiments.[48] These historical inflection points allow researchers to observe exactly how currencies react when specific components of the CBMT equation—physical capacity, human capital, or institutional trust—are violently and suddenly destroyed.
5.1 Haiti 2010: Physical Capacity Shock and Institutional Substitution
Natural disasters instantly destroy physical capital and disrupt short-term aggregate labor efficiency, thereby severely reducing the actual impact an economy can generate. Under standard monetary theory, a sudden reduction in the supply of goods alongside a constant money supply inevitably leads to inflation. Under CBMT, a natural disaster directly degrades the asset side of the sovereign balance sheet, triggering significant currency depreciation.[49] Extensive empirical evaluations confirm this mechanism; research demonstrates that in emerging markets and developing economies with flexible exchange rate regimes, natural disasters lead to significant depreciations in nominal and real effective exchange rates, often depreciating by up to six to seven percent within two years following the shock.[49, 50, 51] Furthermore, major disasters trigger a statistically significant decline in net investment flows and portfolio capital, reflecting a sudden spike in the market's assessment of regime risk.[52]
However, the nature of the institutional realization rate heavily dictates the final monetary outcome, a dynamic perfectly illustrated by the 2010 Haiti earthquake. The catastrophic 7.3 magnitude geological event resulted in the loss of over 200,000 lives, representing more than two percent of the total population and inflicting a massive destruction of human capital and aggregate labor.[53, 54, 55] The macroeconomic damages were estimated between $7.8 billion and $13.9 billion, equivalent to over 120 percent of Haiti's 2009 GDP.[53, 54, 56] Despite this near-total destruction of physical production capacity, the exchange rate of the Haitian gourde experienced a remarkably muted reaction, and the consumer price index remained relatively stable.[55]
Why did the currency not collapse in tandem with the physical capacity? CBMT accounts for this paradox through the mechanism of international institutional intervention. Following the disaster, a massive influx of foreign aid, debt relief (which reduced external public debt stocks by 60 percent), and diaspora remittances flooded the country.[49, 53] Crucially, the presence of the international community and United Nations stabilization forces (MINUSTAH) temporarily substituted the domestic Leviathan, ensuring that the institutional realization of incoming aid was structurally guaranteed.[57, 58] The foreign currency reserves accumulated by the central bank acted as a robust buffer, artificially maintaining the claim value of the currency despite the underlying domestic production capacity being entirely shattered.[55] The Haiti case demonstrates that if the institutional realization rate can be externally stabilized, the pricing of the currency can decouple from immediate physical shocks.
5.2 Lebanon 2019: The Complete Collapse of the Institutional Realization Rate
If Haiti represents a physical capacity shock buffered by exogenous institutional intervention, Lebanon represents the inverse phenomenon: a profound, self-inflicted destruction of institutional trust leading to a complete currency collapse, despite the physical infrastructure initially remaining fully intact.
Preceding October 2019, Lebanon maintained an artificially pegged exchange rate of 1500 Lebanese Pounds to the US Dollar through what financial analysts universally describe as a Ponzi-like financial engineering scheme orchestrated by the Banque du Liban.[59, 60, 61, 62] The central bank offered exorbitant, unsustainable interest rates to attract US dollars from the diaspora to maintain the peg and finance chronic, deeply corrupt state deficits.[60] In CBMT terms, the sovereign state was utilizing Zahavi’s Handicap Principle improperly; it was burning massive amounts of capital to signal a structural capacity it did not actually possess.[1]
When the inflow of foreign capital suddenly stopped amidst popular uprisings, the market instantaneously updated its regime probabilities via the Hamilton Filter mechanism, shifting permanently to the collapse regime.[61, 63] The institutional realization rate imploded. The state arbitrarily locked depositors out of their foreign currency accounts, creating a fictitious bank money dubbed the "Lollar," which severed the legal property rights fundamental to a functioning economy.[59, 62, 64] The cash value of a "Lollar" check eventually plummeted to just 16 percent of its nominal amount, reflecting a massive, unlegislated haircut on the population's wealth.[59]
The devastating consequences validate the deepest theoretical assertions of Capacity-Based Monetary Theory:
- Explosion of the Shadow Economy: As formal banking became legally synonymous with expropriation, the transaction costs of the formal sector approached infinity. Citizens completely abandoned the formal banking sector, causing the economy to rapidly dollarize and migrate entirely to physical cash and informal digital wallets.[62, 65, 66] By 2022, this cash-driven shadow economy represented an estimated $9.86 billion, comprising an astonishing 45.7% of Lebanon's GDP.[65] Because this massive volume of daily transactions operated entirely outside the sovereign’s purview, it provided zero collateral backing or tax revenue for the Lebanese Pound, inevitably leading to a staggering 98 percent devaluation of the currency.[64]
- Destruction of Human Capital: The shatter of institutional trust initiated a third wave of mass emigration.[67] Highly skilled professionals, doctors, and educators fled the country in an exodus not seen since the civil war.[65, 67, 68] This permanent evaporation of human capital guarantees that even if the money supply were perfectly stabilized today, the long-term future productive capacity of Lebanon has been structurally impaired, thereby logically justifying the currency's near-zero present value.[62, 69]
- Ineffectiveness of Financial Literacy: Remarkably, empirical surveys conducted in Lebanon demonstrated that a highly financially literate population could not prevent the crisis impact.[70] Financial knowledge does not translate into protective action when the entire institutional environment is corrupt; institutional governance acts as the ultimate filter for capacity realization, proving that sophisticated actors cannot save a currency when the state mechanism itself becomes the primary vector of theft.[70]
5.3 Sri Lanka 2022: Policy-Induced Capacity Destruction and Sovereign Default
The 2022 economic crisis in Sri Lanka offers an exceptional case study in how rapid, catastrophic policy errors can systematically degrade both the technological efficiency parameter and institutional trust, culminating in a sovereign default and currency crash.
Following the conclusion of a long civil war, Sri Lanka experienced a prolonged period of debt-fueled infrastructure growth.[71] However, the economic foundations underlying this growth were brittle, characterized by chronically low tax revenues and overvalued exchange rates that hampered export competitiveness.[71, 72] In 2019, the newly elected government enacted sweeping, ill-timed tax cuts that decimated state revenues. By 2022, government revenue amounted to a paltry 8 percent of GDP, compared to 12 percent in 2019 and 18 percent in the early 1990s, severely compromising the fiscal health of the nation and its ability to service debt.[72, 73] Concurrently, the state mandated an abrupt, poorly planned transition to organic farming, effectively banning chemical fertilizers.[73]
In the context of the MRW production function, the fertilizer ban was a catastrophic negative shock to the technology and efficiency variable within the agricultural sector, significantly reducing real output and sparking widespread food shortages.[73, 74] The tax cuts represented a deliberate weakening of the state's institutional capacity to extract revenue.[75] As these self-inflicted vulnerabilities compounded with the exogenous shock of the global COVID-19 pandemic—which wiped out vital foreign exchange from the tourism sector—the country entirely exhausted its foreign reserves trying to defend an unsustainable currency peg.[73, 76]
When Sri Lanka officially announced it would default on $51 billion of external debt in April 2022, the psychological threshold of institutional trust was breached.[77] The Sri Lankan Rupee depreciated by over 50 percent against the US dollar almost instantly, and inflation skyrocketed to nearly 70 percent as the supply of essential goods collapsed.[78] Market participants, recognizing the severe depletion of both actual production capacity and sovereign credibility, demanded a massive risk premium. The Hamilton Markov-switching dynamic was distinctly evident: the slow accumulation of debt and policy errors set the stage over years, but the violent shift in currency valuation occurred abruptly when the regime change was universally recognized by the market.[5]
The eventual stabilization of the Sri Lankan Rupee only began to materialize after a comprehensive sovereign debt restructuring and an IMF bailout were secured in 2023. This intervention effectively acted as an external guarantee to begin repairing the institutional framework, allowing inflation to recede into negative territory by late 2024 and output to begin a slow, painful recovery.[77, 79, 80]
6. Analytical Synthesis and Econometric Expectations
By synthesizing the theoretical constructs of Capacity-Based Monetary Theory, the proposed econometric methodologies, and the empirical realities demonstrated by the historical case studies, several distinct expectations emerge for the results of the proposed data analysis.
First, econometric testing utilizing Nonlinear ARDL approaches will likely reveal highly asymmetric effects regarding currency valuation.[19, 20] The accumulation of human capital and physical capital strengthens a currency slowly and linearly over decades, reflecting the gradual nature of educational attainment and infrastructure development.[81, 82] However, the degradation of institutional trust weakens a currency exponentially. When WGI scores fall below a critical threshold, or when the Medina-Schneider shadow economy metric expands beyond a specific percentage of GDP, the elasticity of currency depreciation with respect to institutional decay will spike drastically.[11, 18]
Second, the regression analysis will likely demonstrate that an expanding shadow economy fundamentally neutralizes the macroeconomic benefits of human capital accumulation. Even if the Penn World Table indicates rising educational attainment and skills within a population, if the Institutional Arbitrage Ratio heavily favors the informal sector, the state is mathematically incapable of collateralizing this human capital.[1] Thus, the interaction term incorporating the shadow economy size will exert a strongly negative coefficient on currency valuation, overpowering standard capacity metrics.[38, 83]
Third, standard linear regressions will consistently fail to capture the violent currency collapses witnessed in environments like Lebanon and Sri Lanka. The application of the Hamilton Filter will statistically validate that exchange rates are governed by discrete state transitions and shifting regime probabilities.[4, 84] Inflationary modeling must account for the mathematical probability of being in a crisis state where conventional monetary transmission mechanisms break down entirely due to a shattered social contract.[85]
Finally, the empirical data will confirm that in environments where institutional trust is shattered, mere manipulation of the money supply is insufficient to halt depreciation.[1] If the expected future impact of a society is perceived by the market to be zero due to systemic corruption, capital flight, or a Hobbesian collapse, the currency price will inextricably trend toward zero irrespective of central bank interest rate tightening or liquidity management.[1, 86]
7. Conclusion
Capacity-Based Monetary Theory offers a profound paradigm shift in the field of macroeconomic analysis, relocating the fundamental ontology of fiat value from the superficial mechanics of exchange to the underlying productive capacity of a civilization. Money is, in its purest structural form, a priced claim on the aggregate labor, technological efficiency, human capital, and institutional integrity of the issuing sovereign state.
Conducting an exhaustive econometric evaluation of this theory requires an advanced analytical architecture capable of measuring both the tangible elements of economic production and the highly intangible frictions of human institutional cooperation. By leveraging the Mankiw-Romer-Weil specification to isolate the distinct and vital role of human capital, utilizing the Worldwide Governance Indicators and the Medina-Schneider shadow economy datasets to precisely quantify institutional transaction costs, and deploying System-GMM alongside Hamilton regime-switching models to resolve endogeneity and non-linear shocks, researchers can rigorously test the core axioms of CBMT.
The catastrophic empirical realities observed in Lebanon and Sri Lanka—where the sudden evaporation of institutional trust, rampant corruption, and policy-induced capacity destruction led to complete, devastating currency collapses—serve as stark validations of the theory. Conversely, the aftermath of the 2010 Haiti earthquake demonstrates how massive external institutional guarantees and foreign capital can temporarily support monetary value even amidst profound physical devastation. Ultimately, the empirical implementation of Capacity-Based Monetary Theory underscores a fundamental, inescapable truth of political economy: securing sound money requires far more than technocratic adjustments to interest rates or money supply; it demands the relentless cultivation of human capital and the unwavering, transparent defense of the institutional social contract.
-
Capacity-Based Monetary Theory
Douglass C. North: Transaction Costs, Property Rights, and Economic Outcomes - NBER, accessed May 4, 2026, https://www.nber.org/system/files/working_papers/w24585/w24585.pdf
Institutions - American Economic Association, accessed May 4, 2026, https://www.aeaweb.org/articles?id=10.1257/jep.5.1.97
Regime-Switching Models | Request PDF - ResearchGate, accessed May 4, 2026, https://www.researchgate.net/publication/52008180_Regime-Switching_Models
Regime-Switching Models - UC San Diego Department of Economics, accessed May 4, 2026, https://econweb.ucsd.edu/~jhamilto/palgrav1.pdf
Hamilton/Lindgren Regime Switching Models - John Hassler, accessed May 4, 2026, http://hassler-j.iies.su.se/courses/EMPMACRO/LECTS961.PDF
Human Capital, Institutional Quality and Economic Growth – The Mediating Effect of Digital Adoptions, Creative Outputs, and Total Factor Productivity, accessed May 4, 2026, https://gipe.ac.in/human-capital-institutional-quality-and-economic-growth-the-mediating-effect-of-digital-adoptions-creative-outputs-and-total-factor-productivity/
Human capital formation and economic growth across the world: a panel data econometric approach - Redalyc, accessed May 4, 2026, https://www.redalyc.org/journal/111/11162788002/html/
Quality-adjusted Human Capital and Productivity Growth - Monash University, accessed May 4, 2026, https://www.monash.edu/__data/assets/pdf_file/0006/925458/4810qualityislam.pdf
The relationship between Economic Growth and Inflation - Diva-portal.org, accessed May 4, 2026, https://www.diva-portal.org/smash/get/diva2:1974028/FULLTEXT01.pdf
Institutional quality and the relationship between inflation and economic growth, accessed May 4, 2026, https://ideas.repec.org/a/spr/empeco/v58y2020i2d10.1007_s00181-018-1479-7.html
Inflation and human capital formation : theory and panel data evidence - RePEc: Research Papers in Economics, accessed May 4, 2026, http://repec.org/mmfc03/HeylenRev.pdf
Inflation and human capital formation : theory and panel data evidence, accessed May 4, 2026, http://fmwww.bc.edu/repec/mmfc03/Heylen.pdf
Inflation, human capital and long-run growth - Working Paper Series, accessed May 4, 2026, https://wps-feb.ugent.be/Papers/wp_01_116.pdf
Modelling the Shadow Economy: An Econometric Study of Technology Development and Institutional Quality - MDPI, accessed May 4, 2026, https://www.mdpi.com/2227-7390/13/24/3914
The growth effect of EU funds – the role of institutional quality - European Central Bank, accessed May 4, 2026, https://www.ecb.europa.eu/pub/pdf/scpwps/ecb.wp3014~757446ef99.en.pdf
Do Actions Speak Louder Than Words? Assessing the Effects of Inflation Targeting Track Records on Macroeconomic Performance, accessed May 4, 2026, https://www.imf.org/-/media/Files/Publications/WP/2022/English/wpiea2022227-print-pdf.ashx
Governance thresholds and the human capital–growth nexus | Journal of Economic Studies, accessed May 4, 2026, https://www.emerald.com/insight/content/doi/10.1108/JES-03-2021-0150/full/html
Testing the Effects of Real Exchange Rate Pass-Through to Unemployment in Brazil - MDPI, accessed May 4, 2026, https://www.mdpi.com/2227-7099/6/3/49
On the link between the shadow economy and stock market development: An asymmetry analysis - IDEAS/RePEc, accessed May 4, 2026, https://ideas.repec.org/a/eee/quaeco/v80y2021icp303-316.html
Understanding Hamilton Regime Switching Model using R package - R-bloggers, accessed May 4, 2026, https://www.r-bloggers.com/2022/02/understanding-hamilton-regime-switching-model-using-r-package/
Markov Regime Switching Model - Medium, accessed May 4, 2026, https://medium.com/@zhuofanecon/markov-regime-switching-model-26307ad4678
Measuring human capital using global learning data - Yale Department of Economics, accessed May 4, 2026, http://www.econ.yale.edu/~pg87/Nature_Article.pdf
PWT 11.0 | Penn World Table | Groningen Growth and Development Centre, accessed May 4, 2026, https://www.rug.nl/ggdc/productivity/pwt/?lang=en
Global Comparisons of Income and Productivity: The Penn World Table, accessed May 4, 2026, https://www.productivity.ac.uk/the-productivity-lab/penn-world-table/
Penn World Table - QoG Data Finder, accessed May 4, 2026, https://datafinder.qog.gu.se/dataset/pwt
Human capital in PWT 9.0, accessed May 4, 2026, https://www.rug.nl/ggdc/docs/human_capital_in_pwt_90.pdf
Barro-Lee Dataset - Education Statistics - World Bank, accessed May 4, 2026, https://datatopics.worldbank.org/education/wProjection/bpopmodel
Introduction | Barro-Lee Educational Attainment Dataset, accessed May 4, 2026, http://barrolee.com/?cat=6
Capital, labor and TFP in PWT8.0 | RUG, accessed May 4, 2026, https://www.rug.nl/ggdc/docs/capital_labor_and_tfp_in_pwt80.pdf
Human Capital Index | DataBank, accessed May 4, 2026, https://databank.worldbank.org/YEM-Human-Capital-Index-Charts/id/e41041d6
Human Capital Index - World Bank Data Catalog, accessed May 4, 2026, https://datacatalog.worldbank.org/search/dataset/0038030/human-capital-index
Worldwide Governance Indicators - World Bank, accessed May 4, 2026, https://www.worldbank.org/en/publication/worldwide-governance-indicators
Worldwide Governance Indicators (WGI) - World Bank Open Data, accessed May 4, 2026, https://data360.worldbank.org/en/dataset/WB_WGI
The Worldwide Governance Indicators: - Revised Methodology for Measuring Governance Using Perception Data - World Bank, accessed May 4, 2026, https://www.worldbank.org/content/dam/sites/govindicators/doc/The%20Worldwide%20Governance%20Indicators%202025%20Methodology%20Revision.pdf
The Worldwide Governance Indicators: Methodology and 2024 Update - World Bank, accessed May 4, 2026, https://www.worldbank.org/content/dam/sites/govindicators/doc/wgimethodologypaper.pdf
Worldwide Governance Indicators - DataBank - World Bank, accessed May 4, 2026, https://databank.worldbank.org/source/worldwide-governance-indicators
Institutional quality, shadow economy and entrepreneurship: international evidence - Emerald Insight, accessed May 4, 2026, https://www.emerald.com/ijssp/article/44/1-2/249/1226511/Institutional-quality-shadow-economy-and
Shedding Light on the Shadow Economy: A Global Database and the Interaction with the Official One - IDEAS/RePEc, accessed May 4, 2026, https://ideas.repec.org/p/ces/ceswps/_7981.html
Shadow Economies Around the World: What Did We Learn Over the Last 20 Years?, WP/18/17, January 2018 - International Monetary Fund, accessed May 4, 2026, https://www.imf.org/-/media/files/publications/wp/2018/wp1817.pdf
Shedding Light on the Shadow Economy - A Global Database - International Monetary Fund, accessed May 4, 2026, https://www.imf.org/-/media/files/conferences/2019/7th-statistics-forum/seventh-imf-statistical-forum-medina-schneider-presentation.pdf
Shadow Economies Around the World: What Did We Learn Over the Last 20 Years?, accessed May 4, 2026, https://www.imf.org/en/publications/wp/issues/2018/01/25/shadow-economies-around-the-world-what-did-we-learn-over-the-last-20-years-45583
Shadow Economies around the World: New Results for 158 Countries over 1991-2015, accessed May 4, 2026, https://ideas.repec.org/p/ces/ceswps/_6430.html
WEO - IMF Data - International Monetary Fund, accessed May 4, 2026, https://data.imf.org/en/datasets/IMF.RES:WEO
Data Home - International Monetary Fund, accessed May 4, 2026, https://data.imf.org/
World Economic Outlook (April 2026) - Inflation rate, average consumer prices, accessed May 4, 2026, https://www.imf.org/external/datamapper/PCPIPCH@WEO
World Economic Outlook (April 2026) - International Monetary Fund, accessed May 4, 2026, https://www.imf.org/external/datamapper/datasets/WEO
Governance quality and economic growth: Panel evidence and difference-in - AESS Publications, accessed May 4, 2026, https://archive.aessweb.com/index.php/5009/article/download/5922/8723
Currencies in Turbulence: Exploring the Impact of Natural Disasters on Exchange Rates - International Monetary Fund, accessed May 4, 2026, https://www.imf.org/-/media/files/publications/wp/2024/english/wpiea2024186-print-pdf.pdf
Currencies in Turbulence: Exploring the Impact of Natural Disasters on Exchange Rates, accessed May 4, 2026, https://www.imf.org/en/publications/wp/issues/2024/08/30/currencies-in-turbulence-exploring-the-impact-of-natural-disasters-on-exchange-rates-553991
Currencies in Turbulence: Exploring the Impact of Natural Disasters on Exchange Rates in, accessed May 4, 2026, https://www.elibrary.imf.org/view/journals/001/2024/186/article-A001-en.xml
The Impacts of Disasters on Capital Flows, International Reserves and Exchange Rates - SOAS, accessed May 4, 2026, https://www.soas.ac.uk/sites/default/files/2025-03/economics-wp267.pdf
Haiti 10 years after the earthquake: the fight for social and economic justice continues, accessed May 4, 2026, https://www.eurodad.org/10_years_haiti
Haiti– 2010– PDNA estimated the earthquake impacts equivalent to 120% of GDP | GFDRR, accessed May 4, 2026, https://www.gfdrr.org/en/haiti-2010-pdna-estimated-earthquake-impacts-equivalent-120-gdp
Macroeconomic impacts of the 2010 earthquake in Haiti - Crawford ..., accessed May 4, 2026, https://crawford.anu.edu.au/sites/default/files/2025-02/2017-15_best_burke_wps.pdf
Estimating the Direct Economic Damage of the Earthquake in Haiti - IADB Publications, accessed May 4, 2026, https://publications.iadb.org/en/estimating-direct-economic-damage-earthquake-haiti
Fixing Haiti: MINUSTAH and beyond - United Nations Digital Library System, accessed May 4, 2026, https://digitallibrary.un.org/record/708450/files/Fixing_Haiti.pdf
The World Bank's Experience with Post-Conflict Reconstruction - | Independent Evaluation Group, accessed May 4, 2026, https://ieg.worldbankgroup.org/reports/world-banks-experience-post-conflict-reconstruction
Lebanon's Economic Development Risk: Global Factors and Local Realities of the Shadow Economy Amid Financial Crisis - MDPI, accessed May 4, 2026, https://www.mdpi.com/2227-9091/12/8/122
Understanding the 2019-2020 Banking and Financial Crisis in Lebanon - University of Pennsylvania, accessed May 4, 2026, https://repository.upenn.edu/bitstreams/2043b58b-03a0-4b9e-bcff-de31f1c78beb/download
When Money Breaks: Lebanon's Economic Paradox - The McGill International Review, accessed May 4, 2026, https://www.mironline.ca/when-money-breaks-lebanons-economic-paradox/
Seeking Accountability for Lebanon's Financial Collapse - The ..., accessed May 4, 2026, https://timep.org/2026/04/22/seeking-accountability-for-lebanons-financial-collapse/
Lebanon's Economic Crisis: A Stabilization Plan and an IMF Program - AUB, accessed May 4, 2026, https://www.aub.edu.lb/osb/facultyresearch/bkpi/Documents/Jamali%2C%20Ibrahim%20%282022%29%20-%20Lebanon%E2%80%99s%20Economic%20Crisis-Report%20on%20a%20Webinar%20Series%202.pdf
2024 Investment Climate Statements: Lebanon - State Department, accessed May 4, 2026, https://www.state.gov/reports/2024-investment-climate-statements/lebanon
Navigating Lebanon's Financial Collapse - Dollarization, Banking Dysfunction, and the Road to Recovery, accessed May 4, 2026, https://www.dohainstitute.org/en/Lists/ACRPS-PDFDocumentLibrary/navigating-lebanons-financial-collapse-dollarization-banking-dysfunction-and-the-road-to-recovery.pdf
When Banks Collapse, Code Steps In: How Digital Wallets Became Lebanon's Lifeline, accessed May 4, 2026, https://spacedaily.com/sd-w-when-banks-collapse-code-steps-in-how-digital-wallets-became-lebanons-lifeline/
Displacement in Place and the Financial Crisis in Lebanon | Journal of Refugee Studies | Oxford Academic, accessed May 4, 2026, https://academic.oup.com/jrs/article/37/1/201/7329166
Lebanon's Multifaceted Economic Crisis of October 2019: Causes, Repercussions- A Diagnosis, accessed May 4, 2026, https://erf.org.eg/app/uploads/2022/08/1661157830_526_726054_1562.pdf
Lebanon Economic Monitor: The Deliberate Depression - Documents & Reports, accessed May 4, 2026, https://documents1.worldbank.org/curated/en/474551606779642981/pdf/Lebanon-Economic-Monitor-The-Deliberate-Depression.pdf
Crisis misread: the interplay of governance and financial literacy in Lebanon's 2019 downfall | The Journal of Risk Finance | Emerald Publishing, accessed May 4, 2026, https://www.emerald.com/jrf/article/26/4/624/1270503/Crisis-misread-the-interplay-of-governance-and
Fragile and Conflict-Affected Situations: Intertwined Crises, Multiple Vulnerabilities - Open Knowledge Repository - World Bank, accessed May 4, 2026, https://openknowledge.worldbank.org/bitstreams/d5672993-4d02-413b-ab37-000982c7a3be/download
Sri Lanka's Sovereign Debt Restructuring: Lessons from Complex Processes, WP/25/175, September 2025 - IMF eLibrary, accessed May 4, 2026, https://www.elibrary.imf.org/view/journals/001/2025/175/article-A001-en.pdf
EcOnOmic, PricE and Financial SySTEm STabiliTy, OuTlOOk and POliciES - Central Bank of Sri Lanka, accessed May 4, 2026, https://www.cbsl.gov.lk/sites/default/files/cbslweb_documents/publications/annual_report/2022/en/5_Chapter_01.pdf
A world apart, Lebanon and Sri Lanka share economic collapse | AP News, accessed May 4, 2026, https://apnews.com/article/covid-health-lebanon-asia-55efa30436d38e5885d74d204d7f572b
Tax Giveaways, Struggling Schools : How Low Taxes Drove Sri Lanka's Economic Crisis and Squandered its Education Lead - Human Rights Watch, accessed May 4, 2026, https://www.hrw.org/report/2025/10/14/tax-giveaways-struggling-schools/how-low-taxes-drove-sri-lankas-economic-crisis
Sri Lanka's Sovereign Debt Restructuring: Lessons from Complex Processes in: IMF Working Papers Volume 2025 Issue 175 (2025), accessed May 4, 2026, https://www.elibrary.imf.org/view/journals/001/2025/175/article-A001-en.xml
Sri Lankan economic crisis (2019–2024) - Wikipedia, accessed May 4, 2026, https://en.wikipedia.org/wiki/Sri_Lankan_economic_crisis_(2019%E2%80%932024)
An In-Depth Analysis of Sri Lanka's Economic Crisis (2019–2024) - IJFMR, accessed May 4, 2026, https://www.ijfmr.com/papers/2025/6/62792.pdf
Research Update: Sri Lanka Foreign Currency Ratin | S&P Global Ratings, accessed May 4, 2026, https://www.spglobal.com/ratings/en/regulatory/article/-/view/sourceId/101646659
Sri Lanka's Bailout Blues: Elections in the Aftermath of Economic Collapse, accessed May 4, 2026, https://www.crisisgroup.org/rpt/asia/south-asia/sri-lanka/341-sri-lankas-bailout-blues-elections-aftermath-economic-collapse
The long-run Relationship between Human Capital and Economic Growth in Sweden - Munich Personal RePEc Archive, accessed May 4, 2026, https://mpra.ub.uni-muenchen.de/45183/1/MPRA_paper_45183.pdf
Real exchange rate misalignment and economic growth in East African least developed countries - PMC, accessed May 4, 2026, https://pmc.ncbi.nlm.nih.gov/articles/PMC9712572/
Natural resources, institutions and the quality-adjusted human capital | Journal of Economic Studies | Emerald Publishing, accessed May 4, 2026, https://www.emerald.com/jes/article-split/49/6/1033/432589/Natural-resources-institutions-and-the-quality
Regime Switches in Exchange Rate Volatility and Uncovered Interest Parity, accessed May 4, 2026, https://www.boj.or.jp/en/research/wps_rev/wps_2007/data/wp07e22.pdf
Regime-Switching Models for Estimating Inflation Uncertainty - Federal Reserve, accessed May 4, 2026, https://www.federalreserve.gov/econresdata/feds/2015/files/2015093pap.pdf
ANNUAL REPORT 2022 272 Introduction Role of the Central Bank in Liquidity Management BOX 11 Central, accessed May 4, 2026, https://www.cbsl.gov.lk/sites/default/files/cbslweb_documents/publications/annual_report/2022/en/13_Box_11.pdf

Capacity-Based Monetary Theory and the September 11 Shock: A Macro-Institutional Assessment
Introduction: The Ontological Reassessment of Sovereign Value
The fundamental question of what constitutes money and how it derives its value has persistently bedeviled economists, jurists, and philosophers. Traditional macroeconomic paradigms frequently rely on functional definitions—characterizing money as a medium of exchange, a unit of account, and a store of value. While these tripartite functional definitions describe the symptoms and utility of "moneyness," they fail to adequately explain the ontological asset structure that underpins a fiat currency. In the double-entry bookkeeping of a sovereign civilization, money appears strictly as a liability on the balance sheet of the state. It is a circulating promissory note. However, a liability cannot exist in a theoretical vacuum; it must be balanced by a corresponding asset. Capacity-Based Monetary Theory (CBMT) posits that the asset backing the liability of a modern fiat currency is not gold, nor the mere coercive decree of the state, but rather the Expected Future Impact of the society that issues it.
Under the CBMT framework, money is rigorously redefined as a floating-price claim on the future productive capacity of an economy. When an economic agent accepts a currency in exchange for current tangible goods or services, they are essentially acquiring a call option on the aggregate future labor of that society. They are executing a probabilistic bet that the society will possess the capacity—both physical and institutional—to redeem that claim for real value at a later date. This paradigm effectively extends Adam Smith's classical concept of "Labor Commanded," which dictates that the true value of a commodity is equal to the quantity of labor it enables the possessor to purchase or command.
The events of September 11, 2001, represent one of the most profound exogenous shocks to the economic and institutional structure of the United States. Traditional analyses of this tragedy typically focus on immediate capital destruction, localized employment impacts in lower Manhattan, and the short-term aggregate demand shocks resulting from halted commerce. However, to fully grasp the systemic, long-term alterations to the economic trajectory of the United States, a more robust ontological framework is required. This report applies the rigorous mathematical and theoretical framework of Capacity-Based Monetary Theory to model the macroeconomic and institutional shocks of September 11. Furthermore, it systematically analyzes the effectiveness of the unprecedented legislative and structural responses enacted by the United States government, specifically the USA PATRIOT Act and the creation of the Department of Homeland Security (DHS). By utilizing the mathematical specifications of CBMT—including the Augmented Solow-Swan model, the Institutional Realization Rate, and the Hamilton Filter—this analysis evaluates how the sovereign state's attempt to restore institutional order fundamentally altered the economy's production function. Finally, the report conducts an exhaustive discrepancy analysis, comparing the theoretical predictions generated by CBMT against the real-world macroeconomic data observed between 2000 and 2006, thereby identifying the limitations of the model in a globally integrated, hegemon-dominated financial system.
The Production of Impact and the Augmented Solow-Swan Framework
To evaluate the events of September 11 through the lens of CBMT, it is necessary to first establish the mathematical foundations of the theory. CBMT posits that the value of money is inextricably linked to the magnitude of real output, or "Impact" ($Y$). Impact encompasses the tangible goods, services, and innovations that a society produces. If the money supply remains constant while the capacity to produce impact expands, the purchasing power of money increases, resulting in deflation. Conversely, if the productive capacity degrades while the claim structure (the money supply) remains fixed, the value of the claim is inherently diluted, manifesting as inflation. Therefore, the "price" of money serves as a continuous, real-time index of the economy's underlying production function.
The starting point for quantifying this impact is the neoclassical growth model. However, CBMT argues that the standard Solow-Swan model is insufficient for modern fiat currencies because it treats human capital merely as an undifferentiated component of raw labor. To accurately model the "collateral" of a modern advanced economy like the United States, CBMT integrates the Augmented Solow-Swan model, specifically the Mankiw-Romer-Weil (1992) specification. This framework treats Human Capital ($H$) as an independent factor of production with its own accumulation and depreciation dynamics. The rigorous production function for Impact is defined as:
$$Y = K^\alpha H^\beta (AL)^{1-\alpha-\beta}$$
Where: $Y$ represents total production or "Impact," the underlying collateral of the currency. $K$ represents the stock of physical capital. $H$ represents the stock of Human Capital, encompassing skills, advanced education, and health. $L$ represents the aggregate labor force. $A$ represents labor-augmenting technology, or "Efficiency Capacity." $\alpha$ and $\beta$ represent the elasticities of output with respect to physical and human capital, respectively.
Crucially, the condition $\alpha + \beta < 1$ implies diminishing returns to broad capital accumulation. This specification demonstrates that a currency's strength depends heavily on the investment rate in human capital required to maintain the stock of $H$. Unlike a simple multiplier, human capital is a distinct asset class that constantly depreciates and requires perpetual replenishment. Money, therefore, is a systemic bet on the society's ongoing ability to maintain high levels of Human Capital ($H$) and Efficiency ($A$).
The Micro-Foundations of Human Capital and the 9/11 Shock
While the Mankiw-Romer-Weil specification provides the macro-equation for capacity, Gary Becker's theories provide the micro-foundation. Becker argued that labor is not a fungible, homogeneous commodity, but rather a form of capital accumulated through deliberate investment. His "Theory of the Allocation of Time" suggests that individuals combine market goods and their own time to produce commodities and economic impact. A currency backed by a population with high levels of advanced education represents a claim on a vastly larger pool of potential future impact.
The attacks of September 11 constituted an immediate, violent contraction of both physical capital ($K$) and human capital ($H$). The destruction of the World Trade Center complex resulted in severe physical property damage and cleanup costs, estimated to total between \$33 billion and \$36 billion. More critically within the Beckerian micro-foundation of CBMT, the loss of nearly 3,000 lives represented an acute, highly concentrated shock to Human Capital. The discounted value of the deceased workers' expected future earnings alone was calculated at approximately \$7.8 billion, representing an average of \$2.8 million in lost future impact per worker. Furthermore, the immediate macroeconomic fallout of the attacks temporarily reduced U.S. real GDP growth in 2001 by 0.5% and increased the unemployment rate by 0.11%, equating to an immediate reduction in active labor ($L$) by 598,000 jobs.
However, within the context of a multi-trillion-dollar national economy, the absolute physical and human capital reductions were statistically marginal. As noted in retrospective macroeconomic assessments, the isolated loss of lives and property on September 11 was not large enough to have had a measurable, permanent effect on the aggregate productive capacity of the United States on its own. Therefore, the profound and enduring macroeconomic shifts that followed the attacks cannot be explained merely through the destruction of $K$ and $H$. Instead, the true systemic shock occurred within the institutional and frictionless parameters of the CBMT framework.
The Hobbesian Trap and the Institutional Realization Rate
In the Capacity-Based Monetary Theory framework, theoretical production capacity is entirely irrelevant if the fruits of labor cannot be secured. The "hardware" of impact ($Y$) requires the "software" of robust legal and institutional frameworks to function. Thomas Hobbes classically described the "state of nature" as a condition of perpetual war, where life is "solitary, poor, nasty, brutish, and short". In rigorous economic terms, the Hobbesian state represents a regime characterized by infinite transaction costs.
Money cannot exist in a Hobbesian state. Because money is inherently a claim on the future, if the future is characterized by violence, expropriation, and radical uncertainty, the discount rate applied to future claims becomes effectively infinite. No rational economic agent would exchange a tangible, present good for a token promising a good tomorrow if "tomorrow" brings the likelihood of death or theft. Therefore, the very existence and value of money are predicated entirely on the strength of the Social Contract. The "Leviathan"—the sovereign state—must impose order to artificially lower transaction costs. The fundamental value of a fiat currency is, therefore, a continuous market pricing of the Leviathan's effectiveness at maintaining this order.
CBMT formalizes this relationship by utilizing the insights of Douglass North regarding transaction costs and institutional economics, proposing an Institutional Realization Rate ($IR$). The $IR$ is a coefficient ranging between 0 and 1, defined as:
$$Y_{realizable} = Y_{MRW} \times IR$$
Where $Y_{MRW}$ is the theoretical output predicted by the Mankiw-Romer-Weil model, and $IR$ is the measure of Institutional Quality, encompassing the rule of law, contract enforcement, and physical security. In a highly stable, high-trust society, the $IR$ approaches 1, meaning theoretical capacity is fully realizable. In a failed state experiencing civil war or anarchy, the $IR$ approaches 0, and even with vast natural resources and labor, the realizable impact collapses, taking the currency down with it.
The terrorist attacks of September 11 represented a sudden, catastrophic degradation of the U.S. Institutional Realization Rate. The revelation of unprecedented domestic vulnerability shattered the baseline assumption of sovereign security that underpins the U.S. dollar. The immediate aftermath saw commercial aviation entirely grounded, borders tightly restricted, and major financial markets, including the New York Stock Exchange, forced to close for days. This immediate suspension of the mechanisms of commercial and financial exchange represented an acute plunge in the $IR$ coefficient. Theoretical capacity ($Y_{MRW}$) remained largely intact outside of lower Manhattan, but it could no longer be fully realized into tangible economic impact ($Y_{realizable}$) due to the sudden spike in frictional transaction costs and existential fear.
The Hamilton Filter: Valuing Currency in a Stochastic Regime
Traditional deterministic macroeconomic models frequently fail to account for the sudden risk of the social contract breaking. To accurately price the value of money in a stochastic world prone to exogenous shocks, CBMT employs the Hamilton Filter. The Hamilton Filter, pioneered by James D. Hamilton in 1989, is the standard econometric algorithm for estimating discrete, unobserved regime shifts in time series data.
In the CBMT framework, the fundamental value of money is highly dependent on the probability of the economy operating in a specific state or regime ($S_t$), such as a "Stable Regime" (where $IR \approx 1$) versus a "Collapse Regime" (where $IR \to 0$). The filter recursively estimates the probability of the unobserved state using a prediction step, projecting probabilities forward based on transition matrices, and an update step, which adjusts the probabilities as new data ($y_t$) arrives. The mathematical foundation relies on determining when structural shifts occur and estimating the state transition probabilities governed by a Markov chain.
On the morning of September 11, the global market's collective, internal Hamilton Filter detected an immediate, violent shift in the transition matrix. The probability of the U.S. economy entering a "Collapse Regime" spiked dramatically. In the architecture of CBMT, when the Hamilton Filter detects such a regime shift—suggesting that the Leviathan may be losing control of its monopoly on security—the discount rate spikes, and the demand to hold claims on the future evaporates. The immediate behavioral response of businesses and consumers was entirely rational under this model: economic agents aggressively moved capital from illiquid, future-dependent assets (like equities and long-term bonds) into liquid, present-value assets like cash and checking accounts. Blue Chip Consensus GDP growth forecasts for 2001 were aggressively revised downward from 1.6 percent to 1.1 percent within a month of the attack, reflecting the market's rapid Bayesian updating of regime probabilities.
The Leviathan's Response: Legislation as Structural Friction
Faced with a collapsing Institutional Realization Rate and a Hamilton Filter pointing ominously toward a high-risk regime, the sovereign state was forced to act aggressively to restore the perception of the social contract and lower the probability of future violence. The Leviathan's response took the form of sweeping legislative, intelligence, and bureaucratic overhauls, most notably the USA PATRIOT Act and the Homeland Security Act.
However, according to CBMT, the restoration of $IR$ through coercive state security measures is not cost-free. In fact, it frequently requires the imposition of massive, permanent transaction costs that operate as a structural tax on the "Efficiency Capacity" ($A$) of the economy. While the state may successfully prove it is not a Hobbesian failure, the methods it uses to secure the future can fundamentally degrade the efficiency of generating that future.
The USA PATRIOT Act and Financial Transaction Costs
Passed with overwhelming bipartisan support and signed into law on October 26, 2001, the Uniting and Strengthening America by Providing Appropriate Tools Required to Intercept and Obstruct Terrorism (USA PATRIOT) Act drastically expanded the surveillance and investigative powers of federal law enforcement and intelligence agencies. While the Act is frequently debated in the context of constitutional law and civil liberties, its most profound and enduring economic impact stems from Title III, which imposed stringent Anti-Money Laundering (AML) and Know Your Customer (KYC) regulations on the global and domestic financial sectors.
Prior to 9/11, routine domestic financial transactions carried relatively low regulatory overhead, allowing for high-velocity capital allocation. The Patriot Act effectively drafted the private financial sector into the vanguard of the national security apparatus, significantly expanding the scope of institutions required to monitor, record, analyze, and report suspicious activities. This mandate was not limited to large commercial banks; it extended to mutual funds, credit card operators, broker-dealers, futures commission merchants, and small credit unions.
The macroeconomic transaction costs of these provisions were staggering and enduring. The Financial Crimes Enforcement Network (FinCEN) predicted that advanced Customer Due Diligence (CDD) rules alone would cost banks and their customers between \$700 million and \$1.5 billion over a decade, utilizing a "conservative" estimate of \$10 billion for broader regulatory impact studies. Individual large banks estimated their annual compliance costs to range between \$20 million and \$50 million, while midsize banks pegged costs at \$3 million to \$5 million annually.
Viewed strictly through the CBMT framework, these compliance costs represent pure deadweight loss—a structural degradation of the labor-augmenting technology and efficiency variable ($A$) in the Mankiw-Romer-Weil equation. Highly educated labor and advanced capital that could have been deployed toward productive, yield-generating investments were instead diverted into massive regulatory compliance departments, transaction monitoring software systems, and legal consulting. As highlighted by the National Association of Manufacturers and the Securities Industry Association, over 93 percent of compliance costs in the U.S. financial sector are labor-related, indicating a massive diversion of human capital ($H$) away from impact generation.
Furthermore, the implementation of the Patriot Act created an asymmetric wealth redistribution within the banking sector. Empirical studies utilizing comprehensive Call Report data from the Federal Financial Institutions Examination Council (FFIEC) demonstrate that AML compliance costs are characterized by significant economies of scale. Smaller community banks incurred a disproportionately higher compliance burden relative to larger, globally integrated institutions. Banks with assets under \$100 million reported compliance costs averaging almost 10 percent of their total noninterest expense, effectively double the relative burden experienced by the largest community banks. This regulatory friction accelerated industry consolidation, reduced new bank formation, and constrained capital access for local entrepreneurs. By raising the baseline cost of verifying trust, the Leviathan inadvertently degraded the efficiency of capital allocation across the lower tranches of the economy.
The Homeland Security Apparatus and the O-Ring Filter Degradation
In addition to erecting a massive financial surveillance apparatus, the federal government fundamentally restructured its physical security architecture. In March 2003, the Department of Homeland Security (DHS) was created, amalgamating 22 disparate federal agencies and offices under a single cabinet-level department. A central, highly visible component of this reorganization was the federalization of airport security through the creation of the Transportation Security Administration (TSA).
The creation of the DHS and the TSA introduced massive, systemic transaction costs to the physical movement of human capital ($H$) and goods. In the immediate aftermath of 9/11, U.S. exports of travel services (representing foreign tourists visiting the United States) dropped by 12 percent in 2001 and an additional 4 percent in 2002. Visa restrictions, enhanced border checkpoints, and continuous flow-control measures at commercial airports severely constrained the velocity of labor and international trade.
The operations of the TSA require immense annual funding, largely subsidized by direct frictional taxation on travel. The September 11 Security Fee, collected directly from airline passengers, generated roughly \$995 million in 2002. This fee scaled rapidly alongside the bureaucracy, generating \$1.86 billion by 2005, and is projected to exceed \$4.5 billion annually by 2025. Beyond the direct financial extraction, the TSA introduced severe time-based frictional costs that ripple through the macroeconomy. Increased passenger screening delays, rigorous inspection of supply-chain cargo, and strict customs protocols elevated the baseline costs of transport, insurance, and logistics handling.
Within the CBMT paradigm, the generation of elite, high-value economic impact relies heavily on the agglomeration and rapid mobility of human capital. CBMT utilizes Michael Kremer’s "O-Ring Theory of Economic Development" to explain how high-skill workers cluster together in complex production processes to maximize serendipitous synergy and output. By introducing permanent, unpredictable delays into the national aviation and logistics network—where "flow control" measures routinely delay private and commercial flights for hours due to air traffic control staffing shortages and security protocols —the DHS structurally lowered the efficiency parameter ($A$) of the entire U.S. production function. Businesses currently face longer delays at airports and land-border crossings, resulting in augmented insurance fees and reduced overall trade flows.
Evaluating Legislative Effectiveness: Cost-Benefit and Signaling Theory
To objectively evaluate the effectiveness of the Patriot Act and the DHS through the CBMT lens, one must weigh the perceived restoration of the Institutional Realization Rate ($IR$) against the permanent drag imposed on efficiency ($A$) and the diversion of physical capital ($K$).
The Failure of Cost-Benefit Proportionality and Deadweight Loss
From a strict economic cost-benefit perspective, the legislative response was vastly disproportionate to the statistical threat. The cumulative increase in US. domestic homeland security expenditures over the decade following 9/11 exceeded \$1 trillion. However, as researchers John Mueller and Mark G. Stewart have exhaustively documented, security-focused regulations implemented by the DHS have largely been exempt from the rigorous, standardized benefit-cost analyses routinely required for major federal regulations in areas such as environmental protection or transportation safety.
To mathematically justify these enhanced expenditures on a purely economic basis—even using analyses that substantially bias the consideration toward security—the implemented measures would have to prevent, deter, or foil 1,667 otherwise successful terrorist attacks per year (equating to more than four major attacks per day), with each attack inflicting \$100 million in damage. Alternatively, they would need to foil 167 attacks per year inflicting \$1 billion in damage each. This vast discrepancy reveals a severe case of "probability neglect" among policymakers, who focused almost exclusively on worst-case scenarios, inflated terrorist capacities, and assessed relative rather than absolute risk.
The opportunity costs of these expenditures were profound. The estimated \$32 billion per year in direct opportunity costs represented capital that could have been invested in domestic infrastructure, basic scientific research, or education—the exact factors that build Human Capital ($H$) and Technology ($A$). By diverting labor and capital resources away from productive private sector activities and toward reactive, less productive anti-terrorist activities, the legislation initiated a long-term suppression of the nation's baseline productivity growth rate.
Zahavi’s Handicap Principle and the Pricing of Capacity
If the economic cost-benefit analysis fails so dramatically, why did the Leviathan pursue such an inefficient path? CBMT resolves this paradox through the integration of Signaling Theory, specifically Amotz Zahavi’s Handicap Principle. The Handicap Principle posits that signals of strength are only reliable if they are differentially costly—meaning they require the "burning" of capital that a weaker entity could not survive.
When the United States established the DHS, passed the Patriot Act, and launched the broader Global War on Terror, it was engaging in a highly rational, albeit massively expensive, Proof of Surplus Capacity. The signal to the global Hamilton Filter was clear: the United States had generated enough past impact to accumulate vast surplus capital, and it implicitly possessed high confidence in its future ability to replenish it, even while burning trillions of dollars on domestic security theater and overseas military deployments. A low-capacity, failing state could not afford to ground its aviation system, restructure its banking sector, and launch global wars without jeopardizing its very survival. Thus, the massive deadweight loss of the homeland security apparatus served as a costly signal that successfully separated the U.S. Leviathan from actual failed states, forcibly manipulating the Hamilton Filter back toward a "Stable Regime" probability.
The Erosion of the Social Contract: Longitudinal Trust Decay
While the costly signaling initially stabilized the transition matrix, CBMT posits that the ultimate value of money relies on the long-term stability and health of the institutional social contract. Modern firms and economies are cooperative structures that rely on "Fitness Interdependence" or "Shared Fate" to minimize internal transaction costs. If the Leviathan's response to 9/11 was truly effective in the long run, we should observe a sustained high level of public trust in government institutions, reflecting a strong, organic Institutional Realization Rate ($IR$).
Longitudinal polling data from the Pew Research Center, Gallup, and the National Election Studies reveals a starkly different reality, suggesting a severe deterioration of the social contract.
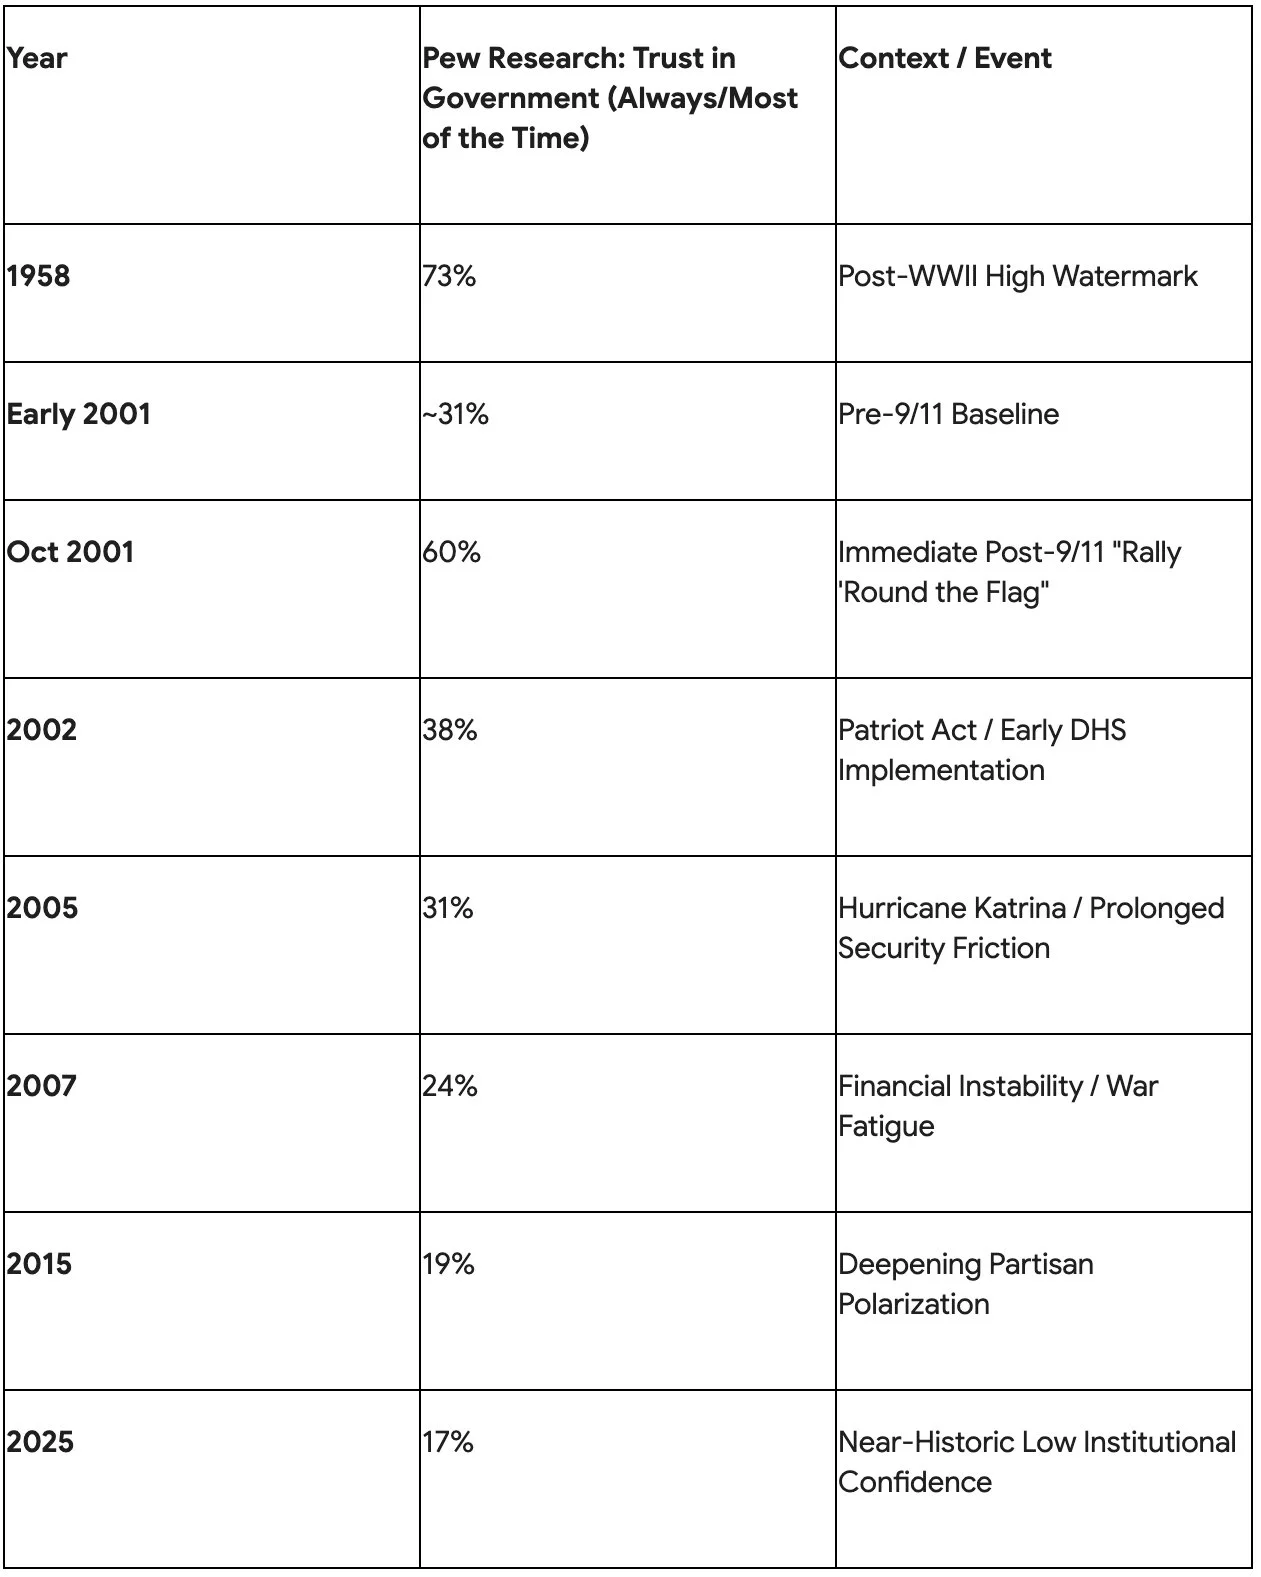
Data compiled from.
In the immediate aftermath of the attacks, there was a profound psychological "rally 'round the flag" effect. In early October 2001, 60 percent of Americans expressed trust in the federal government—roughly double the share from earlier that year, marking the highest level of institutional trust in over four decades.
This spike, however, was highly fleeting. By the summer of 2002, the share of Americans trusting the government plummeted by 22 percentage points. Amid the implementation of the Patriot Act's surveillance authorities, the bureaucratic entanglements of the DHS, the war in Iraq, and ongoing domestic economic uncertainties, trust steadily eroded. By July 2007, trust had fallen to 24 percent. Decades later, by 2025, public trust in the federal government had decayed to a near-historic low of just 17 percent.
Specialized tracking of institutional confidence reveals that the DHS reorganization—moving 22 disparate agencies under a massive new umbrella reporting to Congress—resulted in a deeply dysfunctional, inflexible bureaucracy. Former TSA executives have openly referred to the agency as "hopelessly bureaucratic," with congressional reports blasting it for "costly, counterintuitive, and poorly executed" plans. The failure of the state to seamlessly restore order without infringing heavily on civil liberties, privacy, and economic efficiency paradoxically weakened the underlying social contract. In CBMT terms, while the state's costly signaling prevented the $IR$ from collapsing to zero in 2001, its heavy-handed, high-friction methodologies initiated a slow, multi-decade decay of the institutional coefficient.
CBMT Theoretical Predictions vs. Empirical Macroeconomic Reality
The ultimate test of any economic theory lies in its predictive validity. By applying the pure mechanics of Capacity-Based Monetary Theory to the 9/11 shock and the subsequent legislative friction, we can extrapolate a specific set of theoretical macroeconomic outcomes and compare them against the empirical data observed between 2000 and 2006. This discrepancy analysis reveals both the explanatory power and the crucial blind spots of the CBMT framework.
The Pure CBMT Theoretical Prediction
According to CBMT, money is a priced claim on Expected Future Impact. The events of 9/11 and the government response constituted a severe downward revision of this expected impact due to four intersecting factors:
Immediate, albeit localized, destruction of Physical Capital ($K$) and Human Capital ($H$).
A sudden, severe drop in the Institutional Realization Rate ($IR$) as transaction costs briefly approached the Hobbesian state.
A structural, permanent reduction in Efficiency ($A$) due to the deadweight loss of the ensuing security apparatus (Patriot Act AML costs, TSA travel friction).
A spike in the Hamilton Filter's probability of a "Collapse Regime," leading to a massive increase in the discount rate applied to the future.
Under strict CBMT mechanics, if realizable capacity ($Y_{realizable}$) degrades rapidly while the claim structure (the money supply) remains fixed or expands, the value of the currency must dilute rapidly. Therefore, CBMT would theoretically predict the following outcomes for the U.S. economy post-9/11:
High Inflation: As the "collateral" backing the currency shrinks relative to the money supply, the purchasing power of existing money drops.
Currency Depreciation: A collapse in the foreign exchange value of the U.S. dollar as international investors flee the degrading institutional social contract and rising transaction costs.
Spiking Real Interest Rates: Driven by a surging discount rate, as economic agents demand high risk premiums to hold claims on an uncertain future characterized by violence and institutional inefficiency.
The Real-World Empirical Data (2000–2006)
The empirical macroeconomic reality sharply diverged from the direst CBMT theoretical predictions. The U.S. macro-economy demonstrated profound resilience, absorbing the shock with surprising stability.
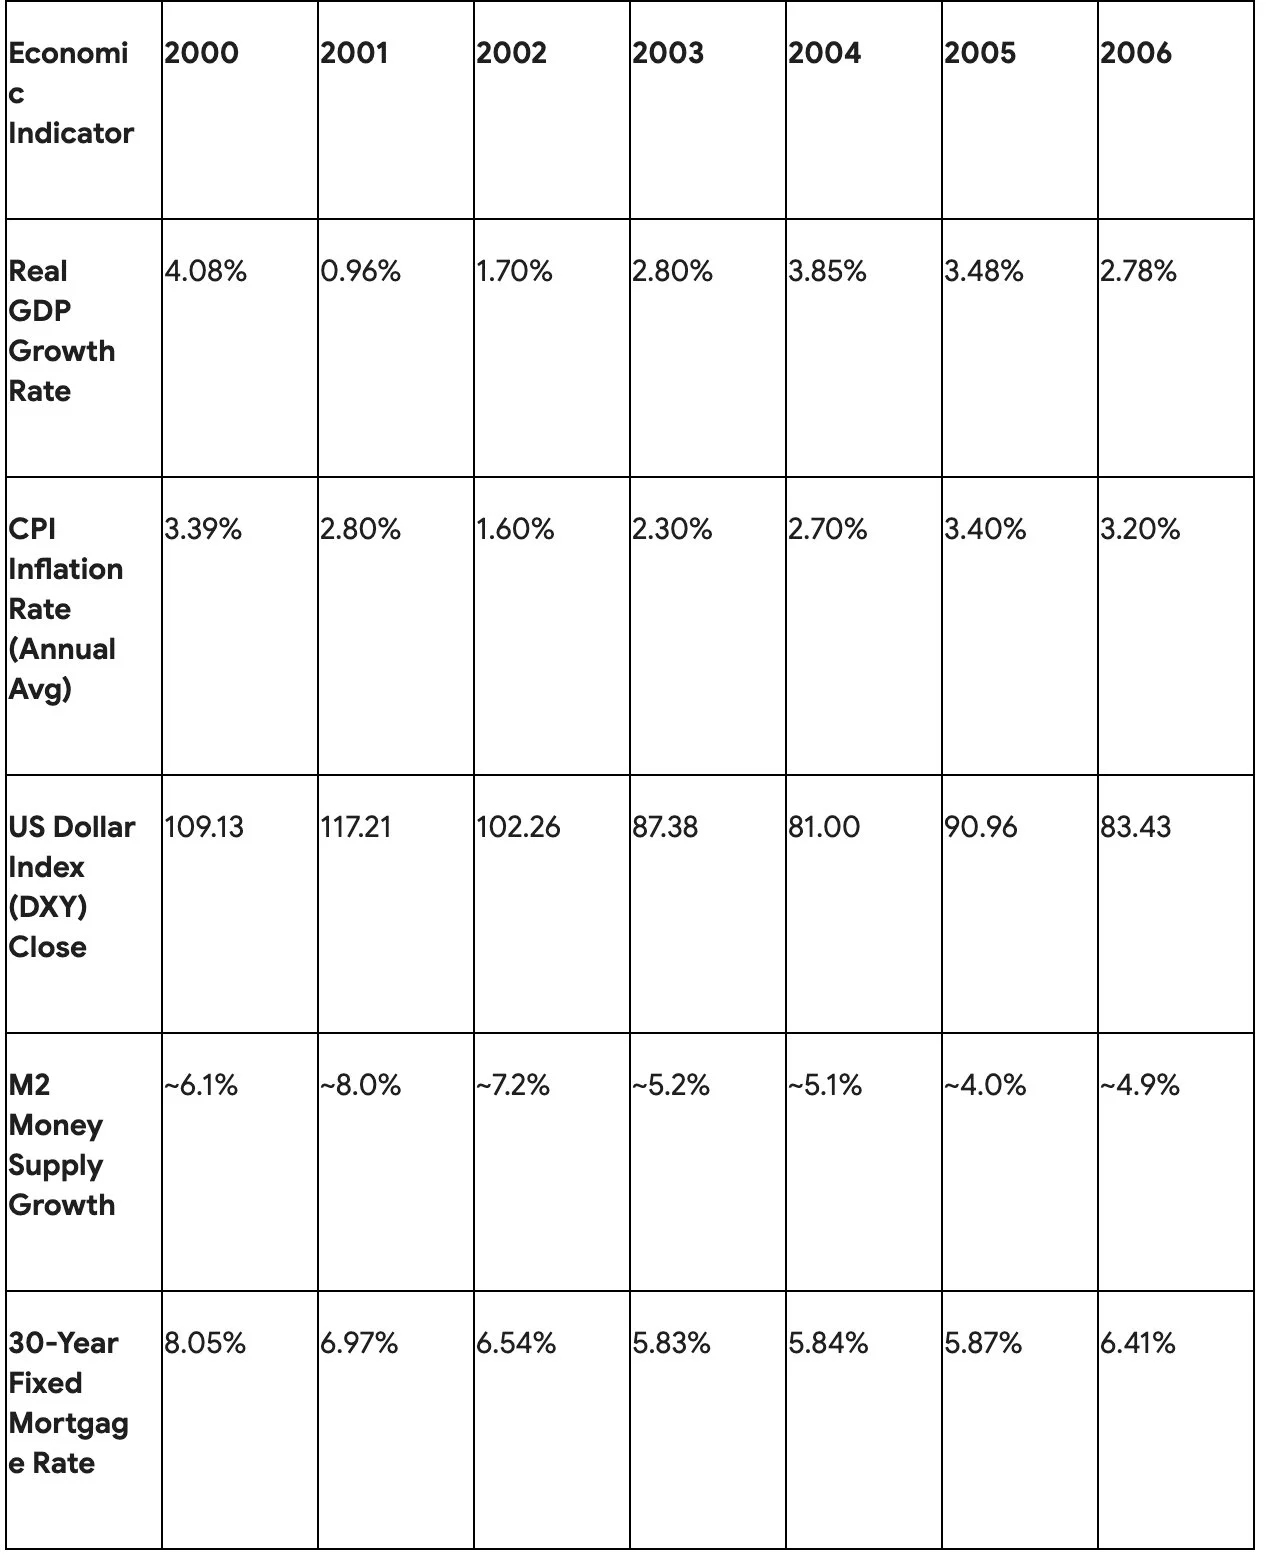
Data compiled from Federal Reserve Economic Data (FRED), Bureau of Labor Statistics, and Macrotrends historical datasets. Note: 30-Year Fixed Mortgage rates are used as a proxy for consumer-facing long-term interest rates.
1. GDP Resilience: While the U.S. economy was already in a contractionary phase prior to September 2001, real GDP growth slowed to 0.96% in 2001 but immediately rebounded to 1.70% in 2002 and 2.80% in 2003. The forecasted "jobless recovery" materialized early in 2002, but aggregate output recovered far faster than a "collapse regime" transition matrix would suggest.
2. Muted Inflation: Contrary to the CBMT prediction of rapid currency dilution resulting from degraded capacity, inflation actually fell in the immediate aftermath of the attacks. The CPI inflation rate dropped from 3.39% in 2000 to 2.80% in 2001, and further plummeted to 1.60% in 2002. It was not until 2005 that inflation returned to pre-9/11 levels (3.40%), largely driven by soaring energy prices rather than pure capacity degradation.
3. Dollar Strength: The U.S. Dollar did not experience an immediate run or depreciation. In fact, the DXY index closed significantly higher at the end of 2001 (117.21) than it did in 2000 (109.13). While the dollar did enter a multi-year depreciation trend thereafter—bottoming at 81.00 in 2004—the immediate reaction was one of aggressive currency strengthening, confounding standard capacity-dilution models.
4. Falling Real Interest Rates: Rather than spiking due to a surging discount rate and infinite transaction costs, nominal and real interest rates fell precipitously. A highly accommodative monetary policy engineered by the Federal Reserve lowered the target federal funds rate aggressively, keeping inflation pressures muted and credit spreads narrow. Average 30-year mortgage rates fell sequentially from 8.05% in 2000 to 5.83% by 2003.
Reconciling the Discrepancy: Hegemony, Liquidity, and the Solow Residual
The material differences between CBMT's pure theoretical predictions and the real-world macroeconomic facts expose necessary nuances, external variables, and missing dimensions in the base theory. Understanding why the U.S. economy defied the gravitational pull of capacity degradation requires examining three primary mitigating factors.
The Open-Economy Hegemon Exemption
CBMT, as articulated in its foundational text, primarily describes a closed institutional system where domestic capacity strictly dictates domestic currency value. However, the United States is the issuer of the global reserve currency. When the 9/11 shock occurred, the rest of the world did not view the event merely as an isolated degradation of U.S. capacity; they viewed it as a systemic global destabilization event.
Consequently, international capital engaged in a massive "flight to safety"—paradoxically rushing into U.S. Treasury securities and dollar-denominated assets. This immense exogenous demand for the dollar explains why the DXY index spiked to 117.21 in 2001, strengthening against a basket of foreign currencies despite the attacks on the U.S. homeland. The U.S. Leviathan benefits from a global institutional premium that buffers it against domestic $IR$ shocks. Because global trade and commodities are priced in dollars, the U.S. currency operates somewhat independently of immediate, localized capacity shocks, a reality that CBMT must incorporate to accurately model hegemonic fiat systems.
Monetary Accommodation and Velocity Collapse
CBMT accurately notes that if capacity ($Y$) drops, the value of the claim must dilute—if the supply of claims remains constant or grows. In the days and months following 9/11, the Federal Reserve took unprecedented action to flood the financial system with liquidity to prevent a deflationary spiral and maintain the clearing of checks and transactions. The M2 money supply growth rate surged, maintaining levels above 8.0% throughout the latter half of 2001.
In a standard quantity-theory framework, this massive injection of liquidity combined with a shock to capacity should have triggered immediate inflation. However, because the velocity of money collapsed—as consumers, businesses, and investors hoarded cash and shifted to highly liquid assets due to profound psychological uncertainty—the massive expansion of M2 simply offset the velocity shock. Thus, inflation fell to 1.6% in 2002. CBMT's intense focus on long-term capacity ($Y_{realizable}$) struggles to account for these short-term, central-bank-engineered liquidity bridges that effectively prevent the Hamilton Filter from locking the economy into a terminal "Collapse Regime."
The Solow Residual Boom: Masking Regulatory Deadweight Loss
Finally, CBMT assumes a somewhat rigid relationship between institutional friction, transaction costs, and overall capacity realization. While the DHS and the Patriot Act undoubtedly introduced severe deadweight losses and degraded efficiency, the U.S. economy demonstrated extraordinary underlying adaptability.
During the latter half of the 1990s and continuing robustly through the early 2000s, labor productivity (defined as output per hour) in the nonfarm business sector surged. From 2000 to 2007, productivity growth averaged between 0 and 4 percent per year across most industries, heavily driven by the integration of information technology (IT), advanced software, and wireless telecommunications.
This underlying boom in the efficiency variable ($A$) and the Solow Residual effectively masked the deadweight loss imposed by the homeland security regulations. The technological amplification of labor and the optimization of supply chains were so potent that they vastly outpaced the frictional drag of TSA screening lines, Patriot Act AML compliance costs, and border delays. The U.S. economy grew despite the imposition of the new security state, not because of it. The technological expansion of the production function absorbed the shock, allowing the Leviathan to impose trillions of dollars in security costs without immediately plunging the nation into a stagflationary crisis.
Synthesis and Conclusion: The Long-Term Institutional Legacy
Applying Capacity-Based Monetary Theory to the events of September 11, 2001, provides a deeply illuminating framework for understanding the ontological shift in the American economy over the past two decades. While traditional economic analysis successfully measures the physical destruction of the day and the immediate fiscal outlays, CBMT forces the analyst to rigorously measure the destruction of institutional efficiency and the manipulation of the social contract.
The legislative response to 9/11—most prominently the USA PATRIOT Act and the establishment of the Department of Homeland Security—was an aggressive, highly rational attempt by the Leviathan to restore the Institutional Realization Rate ($IR$) and prevent a permanent regime shift in the macroeconomic Hamilton Filter. By utilizing Zahavi's Handicap Principle, the state burned massive amounts of capital to signal its enduring strength to the global market.
However, an analysis of the effectiveness of this legislation reveals profound structural failures and hidden taxes. The imposition of over \$1 trillion in domestic security costs, the creation of regressive, wealth-redistributing compliance burdens on the banking sector, and the permanent frictional drag on global travel and trade represent severe, enduring deadweight losses. These interventions failed basic cost-benefit analyses by orders of magnitude and ultimately resulted in a steady, two-decade erosion of public trust in government, undermining the very Shared Fate and Fitness Interdependence required to maintain a high-capacity civilization.
Yet, a meticulous discrepancy analysis reveals that CBMT's direst theoretical predictions of hyperinflation, spiking interest rates, and immediate currency collapse did not materialize. The U.S. economy was buffered not by its newly erected security apparatus, but by the exogenous demand for the dollar as a global reserve asset, masterful short-term liquidity interventions by the Federal Reserve, and a historic, underlying boom in technological productivity that vastly outpaced the government's newly imposed transaction costs.
Ultimately, the events of 9/11 and the subsequent legislative responses fundamentally and permanently altered the production function of the United States. The nation transitioned into a state of permanently elevated institutional friction. By viewing money not just as a medium of exchange, but as a dynamically priced claim on future impact, it becomes evident that the true, lasting cost of the post-9/11 security apparatus was not just the physical capital expended, but the vast expanse of future human capacity that was restricted, diverted, and never fully realized.